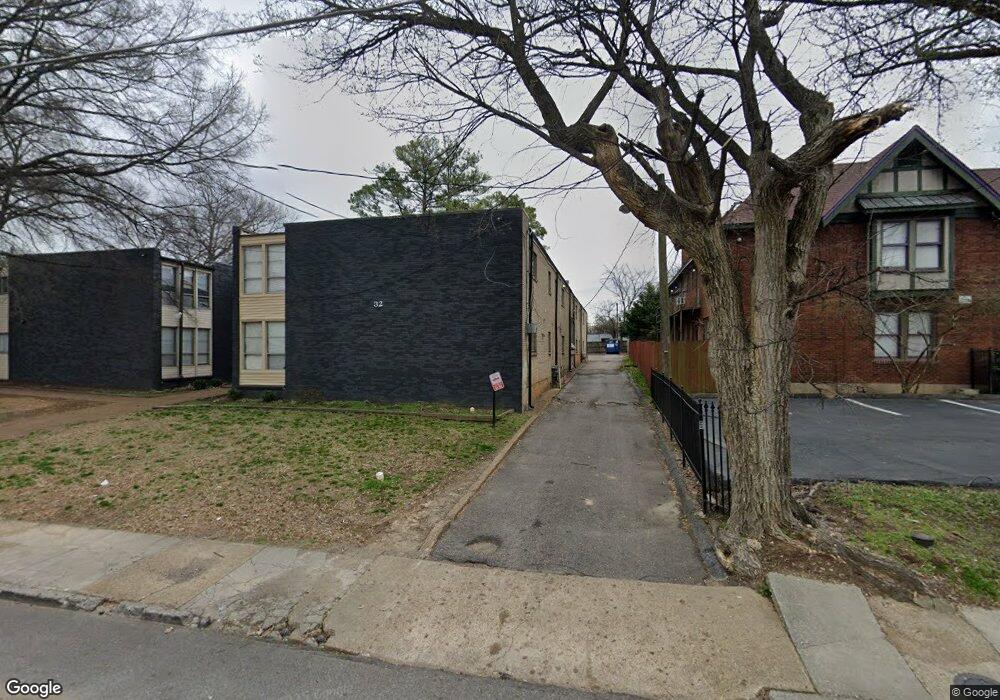
32 N Belvedere Blvd Unit 2 Memphis, TN 38104
Midtown Memphis NeighborhoodEstimated Value: $73,000 - $77,000
2
Beds
1
Bath
800
Sq Ft
$93/Sq Ft
Est. Value
About This Home
This property is walking distance from Overton Square!
Ownership History
Date
Name
Owned For
Owner Type
Purchase Details
Closed on
Dec 28, 2021
Sold by
Carter Helen
Bought by
Carr Jerrica J
Current Estimated Value
Home Financials for this Owner
Home Financials are based on the most recent Mortgage that was taken out on this home.
Original Mortgage
$68,000
Outstanding Balance
$54,127
Interest Rate
3.05%
Mortgage Type
New Conventional
Estimated Equity
$20,588
Purchase Details
Closed on
Mar 20, 2019
Sold by
Campbell Jay
Bought by
Carter Helen
Purchase Details
Closed on
Jun 30, 2003
Sold by
Rhodes Randy and Adcock Howard
Bought by
Belvedere Investments Llc
Home Financials for this Owner
Home Financials are based on the most recent Mortgage that was taken out on this home.
Original Mortgage
$231,200
Interest Rate
5.3%
Mortgage Type
Purchase Money Mortgage
Purchase Details
Closed on
May 29, 1998
Sold by
Abernathy & Feagin Inc
Bought by
Rhodes Randy and Adcock Howard X
Create a Home Valuation Report for This Property
The Home Valuation Report is an in-depth analysis detailing your home's value as well as a comparison with similar homes in the area
Home Values in the Area
Average Home Value in this Area
Purchase History
| Date | Buyer | Sale Price | Title Company |
|---|---|---|---|
| Carr Jerrica J | $68,000 | Closetrak Llc | |
| Carter Helen | $67,500 | Erickson Ttl & Closing Llc | |
| Belvedere Investments Llc | $289,000 | -- | |
| Rhodes Randy | $123,000 | -- |
Source: Public Records
Mortgage History
| Date | Status | Borrower | Loan Amount |
|---|---|---|---|
| Open | Carr Jerrica J | $68,000 | |
| Previous Owner | Belvedere Investments Llc | $231,200 |
Source: Public Records
Property History
| Date | Event | Price | List to Sale | Price per Sq Ft |
|---|---|---|---|---|
| 12/16/2024 12/16/24 | Off Market | $1,200 | -- | -- |
| 11/13/2024 11/13/24 | For Rent | $1,200 | -- | -- |
Tax History Compared to Growth
Tax History
| Year | Tax Paid | Tax Assessment Tax Assessment Total Assessment is a certain percentage of the fair market value that is determined by local assessors to be the total taxable value of land and additions on the property. | Land | Improvement |
|---|---|---|---|---|
| 2025 | $250 | $17,300 | $1,225 | $16,075 |
| 2024 | -- | $7,375 | $1,225 | $6,150 |
| 2023 | $449 | $7,375 | $1,225 | $6,150 |
| 2022 | $449 | $7,375 | $1,225 | $6,150 |
| 2021 | $455 | $7,375 | $1,225 | $6,150 |
| 2020 | $350 | $4,825 | $1,225 | $3,600 |
| 2019 | $247 | $7,720 | $1,960 | $5,760 |
| 2018 | $247 | $7,720 | $1,960 | $5,760 |
| 2017 | $253 | $7,720 | $1,960 | $5,760 |
| 2016 | $288 | $6,600 | $0 | $0 |
| 2014 | $288 | $6,600 | $0 | $0 |
Source: Public Records
Map
Nearby Homes
- 45 N Belvedere Blvd Unit 102
- 45 N Belvedere Blvd Unit 108
- 53 N Belvedere Blvd Unit 7
- 53 N Belvedere Blvd Unit 5
- 38 Angelus St
- 75 N Auburndale St
- 96 N Evergreen St
- 105 N Belvedere Blvd Unit 6
- 105 N Evergreen St
- 46 Angelus St
- 122 N Evergreen St
- 108 N Belvedere Blvd Unit 33
- 108 N Belvedere Blvd Unit 34
- 108 N Belvedere Blvd Unit 37
- 1789 Madison Ave Unit 204
- 24 S Auburndale St
- 151 N Belvedere Blvd Unit 4
- 151 N Belvedere Blvd Unit 22
- 151 N Belvedere Blvd Unit 24
- 68 N Willett St
- 32 N Belvedere Blvd Unit 32-10
- 32 N Belvedere Blvd Unit 32
- 32 N Belvedere Blvd Unit 32-7
- 32 N Belvedere Blvd Unit 32-13
- 32 N Belvedere Blvd Unit 32-15
- 32 N Belvedere Blvd Unit 32-9
- 32 N Belvedere Blvd Unit 32-19
- 32 N Belvedere Blvd Unit 32-23
- 32 N Belvedere Blvd Unit 32-1
- 32 N Belvedere Blvd Unit 32-21
- 32 N Belvedere Blvd Unit 32-9 & 15
- 32 N Belvedere Blvd Unit 24
- 32 N Belvedere Blvd Unit 23
- 32 N Belvedere Blvd Unit 22
- 32 N Belvedere Blvd Unit 21
- 32 N Belvedere Blvd Unit 20
- 32 N Belvedere Blvd Unit 19
- 32 N Belvedere Blvd Unit 18
- 32 N Belvedere Blvd Unit 17
- 32 N Belvedere Blvd Unit 16