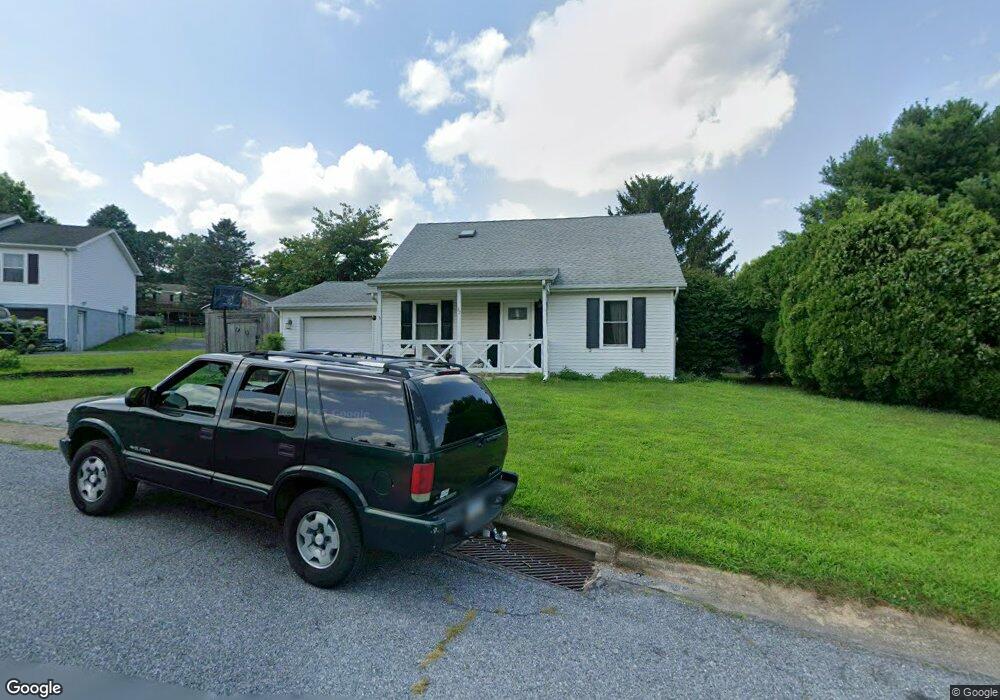
32 Oriole Cir Felton, PA 17322
Estimated Value: $274,000 - $296,000
2
Beds
2
Baths
1,360
Sq Ft
$206/Sq Ft
Est. Value
About This Home
This home is located at 32 Oriole Cir, Felton, PA 17322 and is currently estimated at $280,815, approximately $206 per square foot. 32 Oriole Cir is a home located in York County with nearby schools including Pleasant View Elementary School, Red Lion Area Junior High School, and Red Lion Area Senior High School.
Ownership History
Date
Name
Owned For
Owner Type
Purchase Details
Closed on
Jul 15, 2015
Sold by
Steinhoff Richard W and Steinhoff Sheila L
Bought by
Steinhoff Sheila L
Current Estimated Value
Home Financials for this Owner
Home Financials are based on the most recent Mortgage that was taken out on this home.
Original Mortgage
$108,700
Outstanding Balance
$85,258
Interest Rate
4.03%
Mortgage Type
New Conventional
Estimated Equity
$195,557
Purchase Details
Closed on
Mar 1, 2005
Sold by
Keesee Steinhoff Jr Richard W and Keesee Porch Lisa
Bought by
Steinhoff Richard W and Steinhoff Sheila L
Home Financials for this Owner
Home Financials are based on the most recent Mortgage that was taken out on this home.
Original Mortgage
$127,500
Interest Rate
5.64%
Mortgage Type
New Conventional
Purchase Details
Closed on
Oct 16, 1995
Bought by
Steinhoff Richard W
Create a Home Valuation Report for This Property
The Home Valuation Report is an in-depth analysis detailing your home's value as well as a comparison with similar homes in the area
Home Values in the Area
Average Home Value in this Area
Purchase History
| Date | Buyer | Sale Price | Title Company |
|---|---|---|---|
| Steinhoff Sheila L | -- | None Available | |
| Steinhoff Richard W | -- | -- | |
| Steinhoff Richard W | $89,900 | -- |
Source: Public Records
Mortgage History
| Date | Status | Borrower | Loan Amount |
|---|---|---|---|
| Open | Steinhoff Sheila L | $108,700 | |
| Closed | Steinhoff Richard W | $127,500 |
Source: Public Records
Tax History Compared to Growth
Tax History
| Year | Tax Paid | Tax Assessment Tax Assessment Total Assessment is a certain percentage of the fair market value that is determined by local assessors to be the total taxable value of land and additions on the property. | Land | Improvement |
|---|---|---|---|---|
| 2025 | $4,158 | $135,180 | $28,040 | $107,140 |
| 2024 | $4,026 | $135,180 | $28,040 | $107,140 |
| 2023 | $4,026 | $135,180 | $28,040 | $107,140 |
| 2022 | $4,026 | $135,180 | $28,040 | $107,140 |
| 2021 | $3,890 | $135,180 | $28,040 | $107,140 |
| 2020 | $3,890 | $135,180 | $28,040 | $107,140 |
| 2019 | $3,877 | $135,180 | $28,040 | $107,140 |
| 2018 | $3,836 | $135,180 | $28,040 | $107,140 |
| 2017 | $3,836 | $135,180 | $28,040 | $107,140 |
| 2016 | $0 | $135,180 | $28,040 | $107,140 |
| 2015 | -- | $135,180 | $28,040 | $107,140 |
| 2014 | -- | $135,180 | $28,040 | $107,140 |
Source: Public Records
Map
Nearby Homes
- 18 Oriole Cir
- 1059 Main Street Extension
- 276 Oakbrook Dr
- 151 Cold Stream Trail
- 2733 Manor Furnace Rd
- 2727 Manor Furnace Rd
- 0 Seitz Rd
- 3005 Acorn Ln
- 335 E Snyder Corner Rd
- 1151 Delta Rd
- 2019 Snyder Rd
- 935 Pleasant Grove Rd
- 880 Springvale Rd
- 874 Delta Rd
- 0 Burkholder Rd Unit PAYK2092426
- 1063 Snyder Corner Rd
- 180 Burkholder Rd
- 738 Wise Ave
- 290 Neff Rd
- 209 Forest Hills Rd