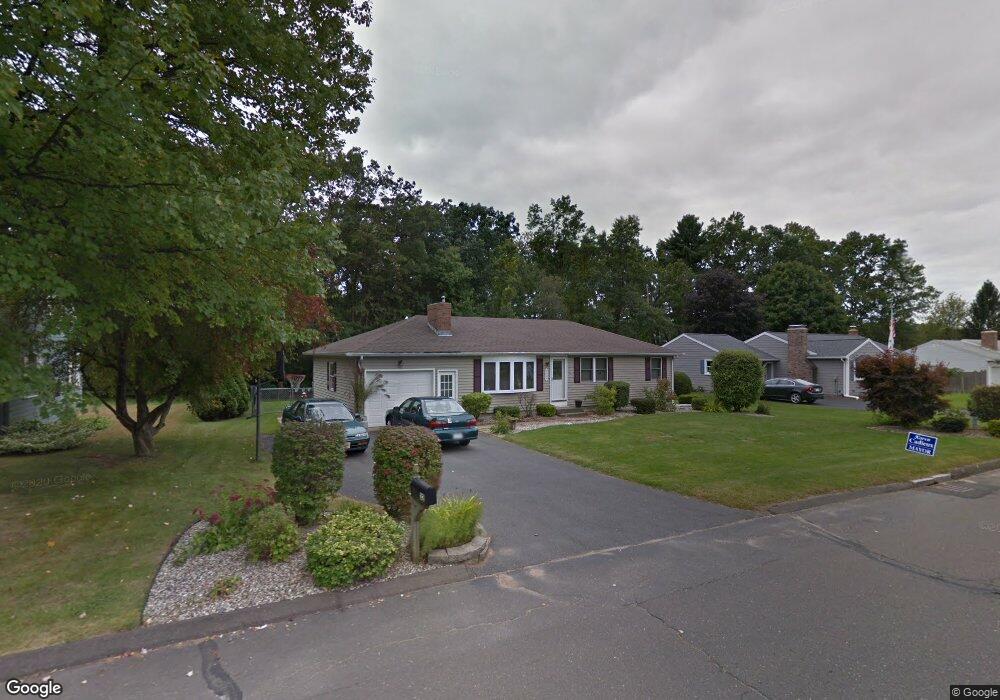
32 Overlook Dr Easthampton, MA 01027
Estimated Value: $406,000 - $425,440
3
Beds
2
Baths
1,134
Sq Ft
$367/Sq Ft
Est. Value
About This Home
This home is located at 32 Overlook Dr, Easthampton, MA 01027 and is currently estimated at $415,860, approximately $366 per square foot. 32 Overlook Dr is a home located in Hampshire County with nearby schools including Easthampton High School, Calvary Baptist Christian School, and Tri-County Schools.
Ownership History
Date
Name
Owned For
Owner Type
Purchase Details
Closed on
Jan 5, 2007
Sold by
Lavertu Stacy A and Lavertu Victoria A
Bought by
Thurman Charles E and Thurman Christine M
Current Estimated Value
Home Financials for this Owner
Home Financials are based on the most recent Mortgage that was taken out on this home.
Original Mortgage
$195,200
Outstanding Balance
$116,846
Interest Rate
6.24%
Mortgage Type
Purchase Money Mortgage
Estimated Equity
$299,014
Create a Home Valuation Report for This Property
The Home Valuation Report is an in-depth analysis detailing your home's value as well as a comparison with similar homes in the area
Home Values in the Area
Average Home Value in this Area
Purchase History
| Date | Buyer | Sale Price | Title Company |
|---|---|---|---|
| Thurman Charles E | $244,000 | -- |
Source: Public Records
Mortgage History
| Date | Status | Borrower | Loan Amount |
|---|---|---|---|
| Open | Thurman Charles E | $195,200 |
Source: Public Records
Tax History Compared to Growth
Tax History
| Year | Tax Paid | Tax Assessment Tax Assessment Total Assessment is a certain percentage of the fair market value that is determined by local assessors to be the total taxable value of land and additions on the property. | Land | Improvement |
|---|---|---|---|---|
| 2025 | $5,178 | $378,800 | $118,700 | $260,100 |
| 2024 | $5,001 | $368,800 | $115,200 | $253,600 |
| 2023 | $3,813 | $260,300 | $90,600 | $169,700 |
| 2022 | $4,303 | $260,300 | $90,600 | $169,700 |
| 2021 | $4,708 | $268,400 | $90,600 | $177,800 |
| 2020 | $4,623 | $260,300 | $90,600 | $169,700 |
| 2019 | $3,590 | $232,200 | $90,600 | $141,600 |
| 2018 | $3,453 | $215,800 | $85,600 | $130,200 |
| 2017 | $3,377 | $208,300 | $82,300 | $126,000 |
| 2016 | $3,502 | $224,600 | $82,300 | $142,300 |
| 2015 | $3,403 | $224,600 | $82,300 | $142,300 |
Source: Public Records
Map
Nearby Homes