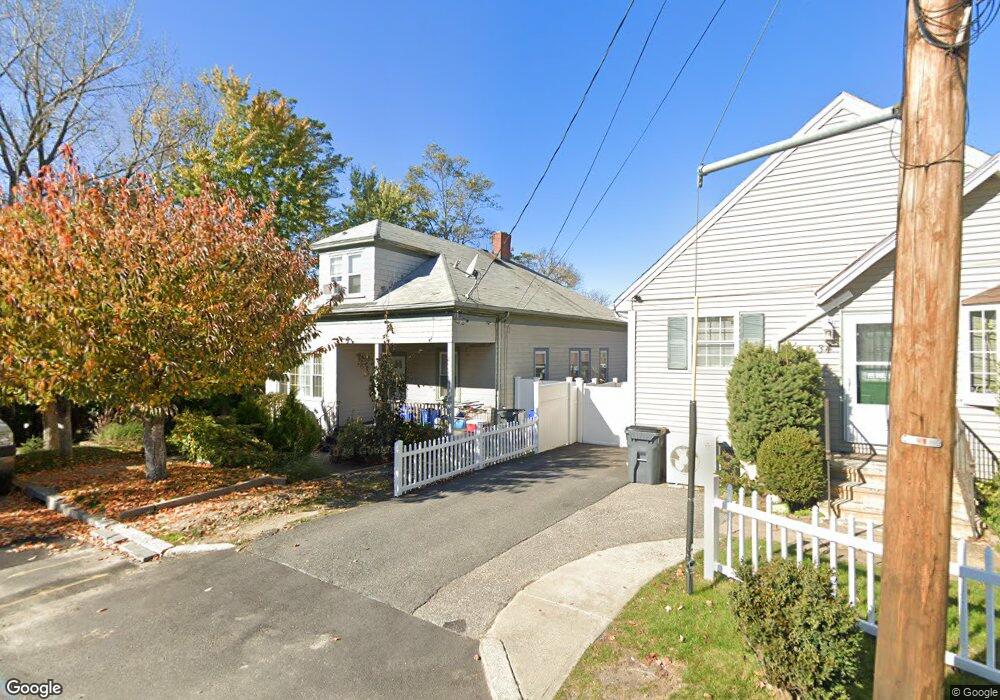
32 Paul St Providence, RI 02904
Charles NeighborhoodEstimated Value: $411,000 - $471,000
3
Beds
1
Bath
1,482
Sq Ft
$299/Sq Ft
Est. Value
About This Home
This home is located at 32 Paul St, Providence, RI 02904 and is currently estimated at $443,563, approximately $299 per square foot. 32 Paul St is a home located in Providence County with nearby schools including Times Squared Academy, Times2 Elementary School, and Times2 Middle/High School.
Ownership History
Date
Name
Owned For
Owner Type
Purchase Details
Closed on
Feb 4, 2021
Sold by
Mota Gabriela
Bought by
Mota Gabriela and Pereira Walter M
Current Estimated Value
Home Financials for this Owner
Home Financials are based on the most recent Mortgage that was taken out on this home.
Original Mortgage
$206,300
Outstanding Balance
$182,223
Interest Rate
2.65%
Mortgage Type
New Conventional
Estimated Equity
$261,340
Purchase Details
Closed on
Apr 13, 2004
Sold by
Lantern Holdings Llc
Bought by
Mota Gabriela
Purchase Details
Closed on
Mar 10, 2004
Sold by
Decesare Janice A
Bought by
Lantern Holdings Llc
Create a Home Valuation Report for This Property
The Home Valuation Report is an in-depth analysis detailing your home's value as well as a comparison with similar homes in the area
Home Values in the Area
Average Home Value in this Area
Purchase History
| Date | Buyer | Sale Price | Title Company |
|---|---|---|---|
| Mota Gabriela | -- | None Available | |
| Mota Gabriela | $202,000 | -- | |
| Lantern Holdings Llc | $170,000 | -- |
Source: Public Records
Mortgage History
| Date | Status | Borrower | Loan Amount |
|---|---|---|---|
| Open | Mota Gabriela | $206,300 | |
| Previous Owner | Lantern Holdings Llc | $205,300 | |
| Previous Owner | Lantern Holdings Llc | $216,502 | |
| Previous Owner | Lantern Holdings Llc | $15,000 |
Source: Public Records
Tax History
| Year | Tax Paid | Tax Assessment Tax Assessment Total Assessment is a certain percentage of the fair market value that is determined by local assessors to be the total taxable value of land and additions on the property. | Land | Improvement |
|---|---|---|---|---|
| 2025 | $3,144 | $374,300 | $133,700 | $240,600 |
| 2024 | $5,391 | $293,800 | $87,700 | $206,100 |
| 2023 | $5,391 | $293,800 | $87,700 | $206,100 |
| 2022 | $5,230 | $293,800 | $87,700 | $206,100 |
| 2021 | $4,453 | $181,300 | $68,800 | $112,500 |
| 2020 | $4,453 | $181,300 | $68,800 | $112,500 |
| 2019 | $4,453 | $181,300 | $68,800 | $112,500 |
| 2018 | $4,385 | $137,200 | $53,100 | $84,100 |
| 2017 | $4,385 | $137,200 | $53,100 | $84,100 |
| 2016 | $4,385 | $137,200 | $53,100 | $84,100 |
| 2015 | $3,717 | $112,300 | $53,800 | $58,500 |
| 2014 | $3,790 | $112,300 | $53,800 | $58,500 |
| 2013 | $3,790 | $112,300 | $53,800 | $58,500 |
Source: Public Records
Map
Nearby Homes
Your Personal Tour Guide
Ask me questions while you tour the home.