Estimated Value: $2,962,000 - $3,653,000
5
Beds
4
Baths
5,788
Sq Ft
$550/Sq Ft
Est. Value
About This Home
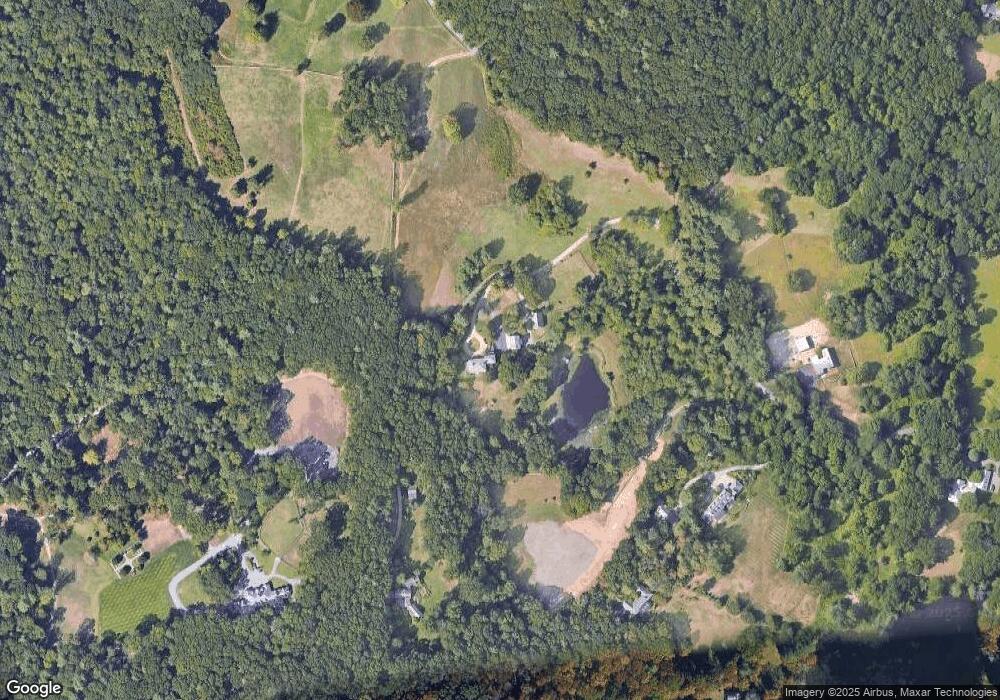
This home is located at 32 Pegan Ln, Dover, MA 02030 and is currently estimated at $3,181,813, approximately $549 per square foot. 32 Pegan Ln is a home located in Norfolk County with nearby schools including Chickering Elementary School, Dover-Sherborn Regional Middle School, and Dover-Sherborn Regional High School.
Ownership History
Date
Name
Owned For
Owner Type
Purchase Details
Closed on
Dec 16, 2013
Sold by
Fitz Wolfgang and Fitz Eileen
Bought by
Petrini Gregory L and Petrini Mary B
Current Estimated Value
Purchase Details
Closed on
Apr 3, 2007
Sold by
Pegan Lane Holdings Ll
Bought by
Petrini Gregory L and Petrini Mary B
Home Financials for this Owner
Home Financials are based on the most recent Mortgage that was taken out on this home.
Original Mortgage
$2,050,000
Interest Rate
6.33%
Mortgage Type
Purchase Money Mortgage
Purchase Details
Closed on
Apr 6, 2004
Sold by
Thompson Nancy E
Bought by
Pegan Lane Hldgs Llc
Home Financials for this Owner
Home Financials are based on the most recent Mortgage that was taken out on this home.
Original Mortgage
$2,050,000
Interest Rate
5.56%
Mortgage Type
Purchase Money Mortgage
Create a Home Valuation Report for This Property
The Home Valuation Report is an in-depth analysis detailing your home's value as well as a comparison with similar homes in the area
Home Values in the Area
Average Home Value in this Area
Purchase History
| Date | Buyer | Sale Price | Title Company |
|---|---|---|---|
| Petrini Gregory L | -- | -- | |
| Petrini Gregory L | $2,658,000 | -- | |
| Pegan Lane Hldgs Llc | $2,450,000 | -- |
Source: Public Records
Mortgage History
| Date | Status | Borrower | Loan Amount |
|---|---|---|---|
| Previous Owner | Petrini Gregory L | $2,050,000 | |
| Previous Owner | Pegan Lane Hldgs Llc | $2,050,000 |
Source: Public Records
Tax History
| Year | Tax Paid | Tax Assessment Tax Assessment Total Assessment is a certain percentage of the fair market value that is determined by local assessors to be the total taxable value of land and additions on the property. | Land | Improvement |
|---|---|---|---|---|
| 2025 | $31,984 | $2,838,000 | $1,254,100 | $1,583,900 |
| 2024 | $30,561 | $2,788,400 | $1,254,100 | $1,534,300 |
| 2023 | $28,727 | $2,356,600 | $1,099,900 | $1,256,700 |
| 2022 | $29,269 | $2,356,600 | $1,099,900 | $1,256,700 |
| 2021 | $31,559 | $2,448,300 | $1,099,900 | $1,348,400 |
| 2020 | $32,327 | $2,517,700 | $1,099,900 | $1,417,800 |
| 2019 | $32,554 | $2,517,700 | $1,099,900 | $1,417,800 |
| 2018 | $30,939 | $2,409,600 | $1,106,700 | $1,302,900 |
| 2017 | $33,002 | $2,528,900 | $1,133,900 | $1,395,000 |
| 2016 | $31,383 | $2,436,600 | $1,140,700 | $1,295,900 |
| 2015 | $32,203 | $2,535,700 | $1,140,700 | $1,395,000 |
Source: Public Records
Map
Nearby Homes
Your Personal Tour Guide
Ask me questions while you tour the home.