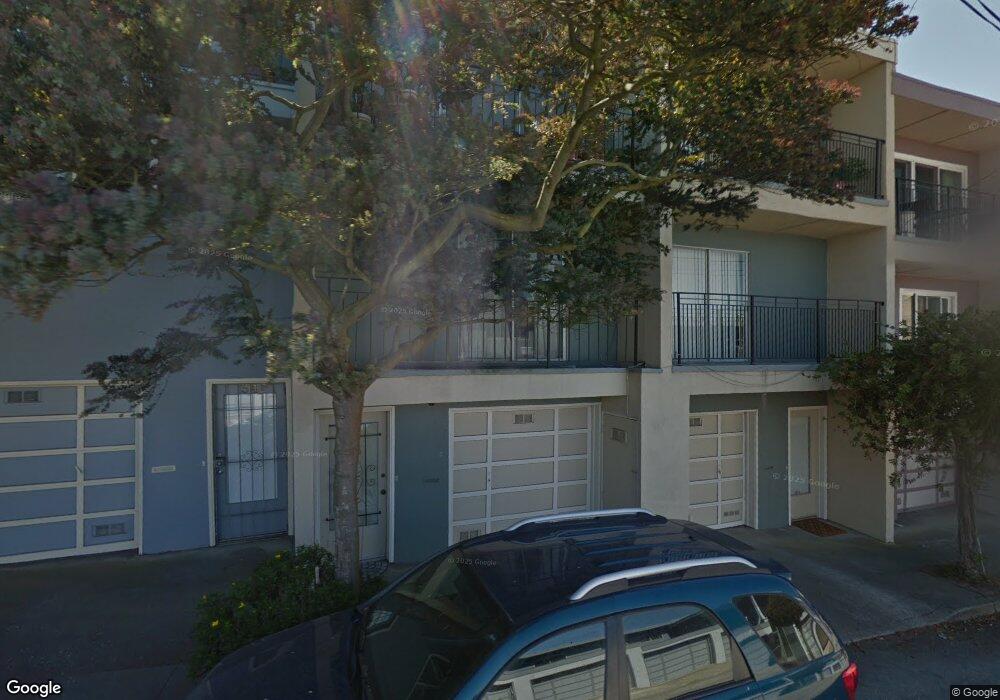
32 Perego Terrace Unit 5 San Francisco, CA 94131
Twin Peaks NeighborhoodEstimated Value: $991,000 - $1,321,771
2
Beds
2
Baths
1,414
Sq Ft
$809/Sq Ft
Est. Value
About This Home
This home is located at 32 Perego Terrace Unit 5, San Francisco, CA 94131 and is currently estimated at $1,143,943, approximately $809 per square foot. 32 Perego Terrace Unit 5 is a home located in San Francisco County with nearby schools including Clarendon Alternative Elementary School, Presidio Middle School, and St. Philip School.
Ownership History
Date
Name
Owned For
Owner Type
Purchase Details
Closed on
Jan 25, 2019
Sold by
Trinh Peter
Bought by
Trinh Peter and Peter Trinh Revocable Trust
Current Estimated Value
Purchase Details
Closed on
Jul 28, 2017
Sold by
Blue Fire Investments Llc
Bought by
Trinh Peter
Home Financials for this Owner
Home Financials are based on the most recent Mortgage that was taken out on this home.
Original Mortgage
$846,400
Outstanding Balance
$704,534
Interest Rate
3.87%
Mortgage Type
Adjustable Rate Mortgage/ARM
Estimated Equity
$439,409
Purchase Details
Closed on
Feb 28, 2017
Sold by
Nalbandian Adrienne A and Nalbandian Carol E
Bought by
Blue Fire Investments Llc
Purchase Details
Closed on
Feb 6, 2016
Sold by
Nalbandian Adrienne A and Nalbandian Robert Ralph
Bought by
Nalbandian Adrienne A and Nalbandian Carol E
Purchase Details
Closed on
Aug 14, 1996
Sold by
Federal National Mortgage Association
Bought by
Nalbandian Robert R
Home Financials for this Owner
Home Financials are based on the most recent Mortgage that was taken out on this home.
Original Mortgage
$178,450
Interest Rate
8.23%
Create a Home Valuation Report for This Property
The Home Valuation Report is an in-depth analysis detailing your home's value as well as a comparison with similar homes in the area
Home Values in the Area
Average Home Value in this Area
Purchase History
| Date | Buyer | Sale Price | Title Company |
|---|---|---|---|
| Trinh Peter | -- | None Available | |
| Trinh Peter | -- | Fidelity National Title Co | |
| Blue Fire Investments Llc | $882,000 | Fidelity National Title Co | |
| Nalbandian Adrienne A | -- | None Available | |
| Nalbandian Robert R | $184,000 | Fidelity National Title Co |
Source: Public Records
Mortgage History
| Date | Status | Borrower | Loan Amount |
|---|---|---|---|
| Open | Trinh Peter | $846,400 | |
| Previous Owner | Nalbandian Robert R | $178,450 |
Source: Public Records
Tax History Compared to Growth
Tax History
| Year | Tax Paid | Tax Assessment Tax Assessment Total Assessment is a certain percentage of the fair market value that is determined by local assessors to be the total taxable value of land and additions on the property. | Land | Improvement |
|---|---|---|---|---|
| 2025 | $14,606 | $1,203,818 | $782,482 | $421,336 |
| 2024 | $14,606 | $1,180,215 | $767,140 | $413,075 |
| 2023 | $14,446 | $1,157,075 | $752,099 | $404,976 |
| 2022 | $14,162 | $1,134,388 | $737,352 | $397,036 |
| 2021 | $13,911 | $1,112,146 | $722,895 | $389,251 |
| 2020 | $13,979 | $1,100,743 | $715,483 | $385,260 |
| 2019 | $13,502 | $1,079,160 | $701,454 | $377,706 |
| 2018 | $13,050 | $1,058,000 | $687,700 | $370,300 |
| 2017 | $11,061 | $906,108 | $453,054 | $453,054 |
| 2016 | $10,874 | $888,342 | $444,171 | $444,171 |
| 2015 | $3,340 | $249,335 | $149,060 | $100,275 |
| 2014 | $2,914 | $244,452 | $146,141 | $98,311 |
Source: Public Records
Map
Nearby Homes
- 20 Parkridge Dr Unit 12
- 49 High St
- 945 Corbett Ave Unit 206
- 8 Fountain St
- 298 Portola Dr Unit 103
- 1230 1240 Twin Peaks Blvd
- 3890 Market St Unit 1
- 464 Hoffman Ave
- 930 Elizabeth St Unit 1
- 89 Glenview Dr
- 4454 23rd St Unit 2
- 833 Corbett Ave
- 447 Hoffman Ave
- 5004 Diamond Heights Blvd Unit 2
- 160 Gardenside Dr Unit 101
- 105 Skyview Way
- 5140 Diamond Heights Blvd Unit 203A
- 29 Cameo Way Unit 1
- 175 Red Rock Way Unit 101K
- 175 Red Rock Way Unit K204
- 36 Perego Terrace Unit 7
- 24 Perego Terrace
- 28 Perego Terrace Unit 3
- 34 Perego Terrace
- 30 Perego Terrace
- 28 Perego Terrace
- 26 Perego Terrace
- 9 Perego Terrace Unit 9
- 9 Perego Terrace Unit 3
- 15 Perego Terrace Unit 1
- 15 Perego Terrace Unit 2
- 5 Perego Terrace Unit 8
- 5 Perego Terrace Unit 5
- 5 Perego Terrace Unit 4
- 5 Perego Terrace Unit 1
- 5 Perego Terrace Unit 22
- 11 Perego Terrace Unit 1
- 15 Perego Terrace Unit 5
- 5 Perego Terrace Unit 17
- 5 Perego Terrace Unit 17