Estimated Value: $464,948 - $557,000
3
Beds
2
Baths
1,654
Sq Ft
$312/Sq Ft
Est. Value
About This Home
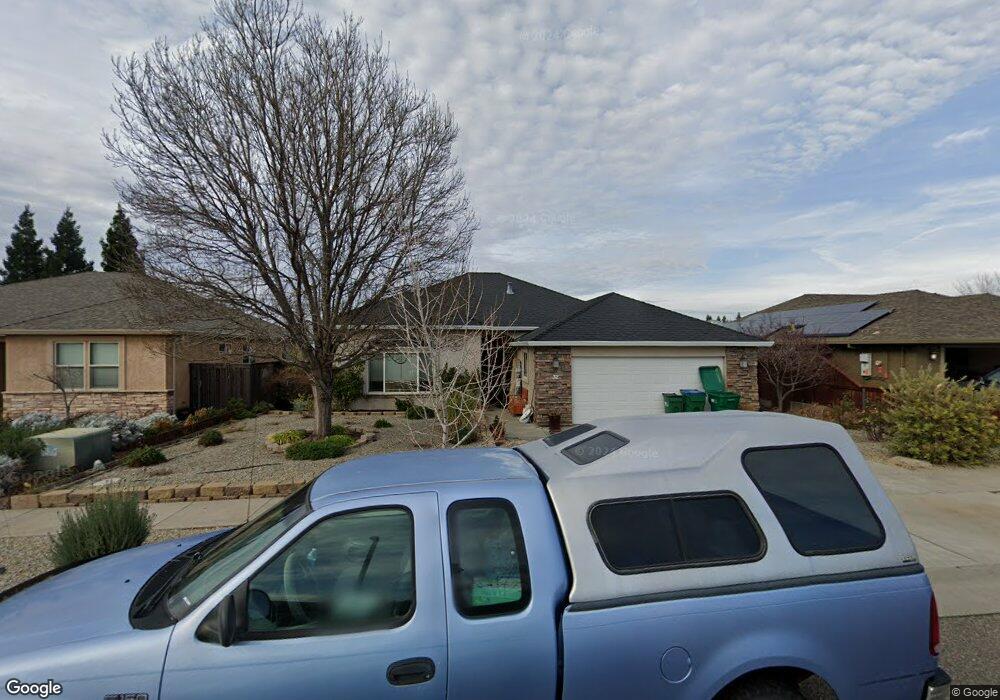
This home is located at 32 Phyllis Ct Unit 90, Chico, CA 95928 and is currently estimated at $515,987, approximately $311 per square foot. 32 Phyllis Ct Unit 90 is a home located in Butte County with nearby schools including Sierra View Elementary School, Harry M. Marsh Junior High School, and Pleasant Valley High School.
Ownership History
Date
Name
Owned For
Owner Type
Purchase Details
Closed on
Mar 29, 2011
Sold by
Fragoso John G
Bought by
Campbell Tara L
Current Estimated Value
Home Financials for this Owner
Home Financials are based on the most recent Mortgage that was taken out on this home.
Original Mortgage
$245,632
Outstanding Balance
$169,067
Interest Rate
4.75%
Mortgage Type
FHA
Estimated Equity
$346,920
Purchase Details
Closed on
Jun 1, 2007
Sold by
Fragoso Sarah
Bought by
Fragoso John G
Home Financials for this Owner
Home Financials are based on the most recent Mortgage that was taken out on this home.
Original Mortgage
$292,000
Interest Rate
6.14%
Mortgage Type
Purchase Money Mortgage
Create a Home Valuation Report for This Property
The Home Valuation Report is an in-depth analysis detailing your home's value as well as a comparison with similar homes in the area
Purchase History
| Date | Buyer | Sale Price | Title Company |
|---|---|---|---|
| Campbell Tara L | $256,000 | Mid Valley Title & Escrow Co | |
| Fragoso John G | -- | Mid Valley Title & Escrow Co | |
| Fragoso John G | $365,000 | Mid Valley Title & Escrow Co |
Source: Public Records
Mortgage History
| Date | Status | Borrower | Loan Amount |
|---|---|---|---|
| Open | Campbell Tara L | $245,632 | |
| Previous Owner | Fragoso John G | $292,000 | |
| Previous Owner | Fragoso John G | $73,000 |
Source: Public Records
Tax History
| Year | Tax Paid | Tax Assessment Tax Assessment Total Assessment is a certain percentage of the fair market value that is determined by local assessors to be the total taxable value of land and additions on the property. | Land | Improvement |
|---|---|---|---|---|
| 2025 | $3,717 | $327,966 | $128,110 | $199,856 |
| 2024 | $3,717 | $321,537 | $125,599 | $195,938 |
| 2023 | $3,583 | $315,234 | $123,137 | $192,097 |
| 2022 | $3,529 | $309,054 | $120,723 | $188,331 |
| 2021 | $3,464 | $302,995 | $118,356 | $184,639 |
| 2020 | $3,454 | $299,889 | $117,143 | $182,746 |
| 2019 | $3,381 | $294,010 | $114,847 | $179,163 |
| 2018 | $3,277 | $288,246 | $112,596 | $175,650 |
| 2017 | $3,244 | $282,595 | $110,389 | $172,206 |
| 2016 | $3,014 | $277,055 | $108,225 | $168,830 |
| 2015 | $3,031 | $272,895 | $106,600 | $166,295 |
| 2014 | $2,968 | $267,550 | $104,512 | $163,038 |
Source: Public Records
Map
Nearby Homes
- 2673 Lakewest Dr
- 451 Palisades Dr
- 3 Kestrel Ct
- 3171 Sandstone Ln
- 457 Brookside Dr
- 18 Kestrel Ct
- 112 Benson Terrace
- 267 Idyllwild Cir
- 2629 Lakewest Dr
- 10 Hidden Brooke Way
- 2636 Amanecida Common
- 2875 Pennyroyal Dr Unit 46
- 2918 Pennyroyal Dr
- 2932 Pennyroyal Dr
- 2820 Pennyroyal Dr
- 3191 Via Casita Place
- 2500 Shooting Star Way Unit 64
- 43 Edgewater Ct
- 26 Sierra Lakeside Ln
- 5 Valley Lake Commons
- 32 Phyllis Ct
- 28 Phyllis Ct
- 36 Phyllis Ct
- 109 Delaney Dr
- 105 Delaney Dr
- 115 Delaney Dr
- 24 Phyllis Ct Unit 88
- 24 Phyllis Ct
- 101 Delaney Dr
- 8 Phyllis Ct Unit 84
- 8 Phyllis Ct
- 0 Phyllis Ct Unit 85
- 12 Phyllis Ct Unit 85
- 12 Phyllis Ct
- 4 Phyllis Ct Unit 83
- 4 Phyllis Ct
- 2 Barker Ct Unit 92
- 2 Barker Ct
- 16 Phyllis Ct
- 121 Delaney Dr
Your Personal Tour Guide
Ask me questions while you tour the home.