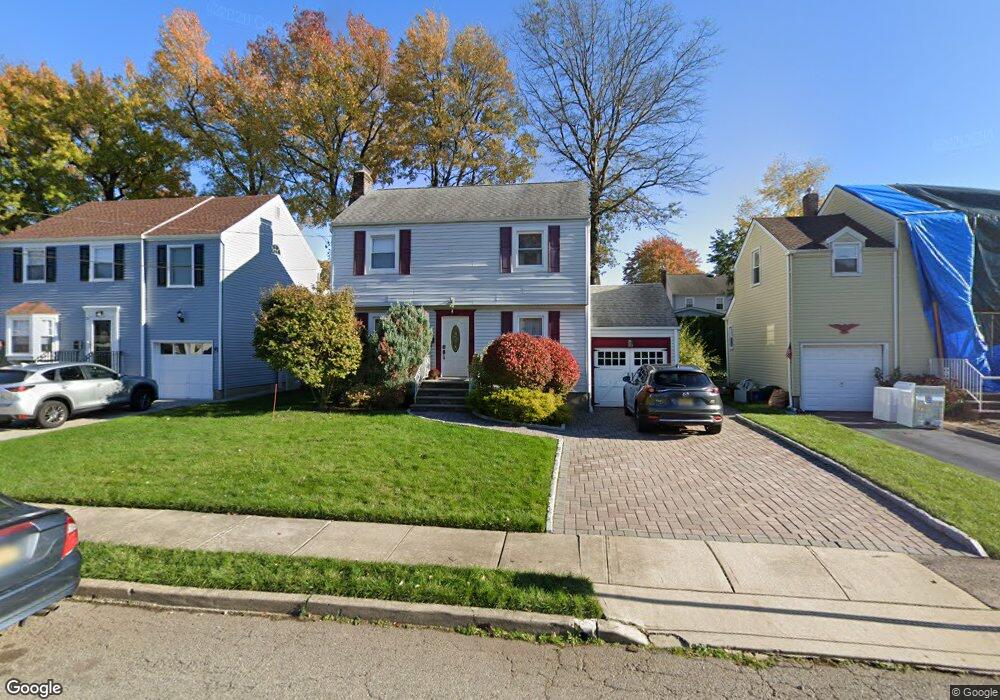
32 Renner Ave Nutley, NJ 07110
Estimated Value: $593,537 - $681,000
Studio
--
Bath
1,284
Sq Ft
$493/Sq Ft
Est. Value
About This Home
This home is located at 32 Renner Ave, Nutley, NJ 07110 and is currently estimated at $632,634, approximately $492 per square foot. 32 Renner Ave is a home located in Essex County with nearby schools including Nutley High School and St Thomas The Apostle School.
Ownership History
Date
Name
Owned For
Owner Type
Purchase Details
Closed on
Feb 11, 2021
Sold by
Jiratatprasot Pornchai and Jiratatprasot Sasiwannapong
Bought by
Jiratatprasot Pornchai and Sasiwannapong Kamonwan
Current Estimated Value
Purchase Details
Closed on
Aug 11, 2006
Sold by
Awe Roger
Bought by
Jiratatprasot Pornchai and Jiratatprasot Sasiwannapong
Home Financials for this Owner
Home Financials are based on the most recent Mortgage that was taken out on this home.
Original Mortgage
$404,316
Interest Rate
6.83%
Mortgage Type
New Conventional
Create a Home Valuation Report for This Property
The Home Valuation Report is an in-depth analysis detailing your home's value as well as a comparison with similar homes in the area
Home Values in the Area
Average Home Value in this Area
Purchase History
| Date | Buyer | Sale Price | Title Company |
|---|---|---|---|
| Jiratatprasot Pornchai | -- | None Available | |
| Jiratatprasot Pornchai | $440,000 | -- |
Source: Public Records
Mortgage History
| Date | Status | Borrower | Loan Amount |
|---|---|---|---|
| Previous Owner | Jiratatprasot Pornchai | $404,316 |
Source: Public Records
Tax History
| Year | Tax Paid | Tax Assessment Tax Assessment Total Assessment is a certain percentage of the fair market value that is determined by local assessors to be the total taxable value of land and additions on the property. | Land | Improvement |
|---|---|---|---|---|
| 2025 | $12,334 | $478,800 | $245,000 | $233,800 |
| 2024 | $12,334 | $478,800 | $245,000 | $233,800 |
| 2023 | $13,709 | $478,800 | $245,000 | $233,800 |
| 2022 | $13,709 | $354,800 | $140,000 | $214,800 |
| 2021 | $13,639 | $354,800 | $140,000 | $214,800 |
| 2020 | $13,064 | $354,800 | $140,000 | $214,800 |
| 2019 | $12,801 | $354,800 | $140,000 | $214,800 |
| 2018 | $12,457 | $354,800 | $140,000 | $214,800 |
| 2017 | $12,322 | $354,800 | $140,000 | $214,800 |
| 2016 | $11,957 | $354,800 | $140,000 | $214,800 |
| 2015 | $11,765 | $354,800 | $140,000 | $214,800 |
| 2014 | $11,616 | $354,800 | $140,000 | $214,800 |
Source: Public Records
Map
Nearby Homes
- 101 Bryant Ave
- 160 Alexander Ave
- 1 Rutan Place
- 355 W Passaic Ave
- 330 W Passaic Ave
- 18 Farmingdale Ave
- 31 Emily Ave
- 198 W Passaic Ave
- 32 N Spring Garden Ave
- 723 Bloomfield Ave
- 741 Bloomfield Ave
- 585 Bloomfield Ave
- 65 Ernst Ave
- 171 Sadler Rd
- 147 Knollwood Terrace
- 96 Orchard Dr
- 225 Hillside Ave
- 41 High St
- 239 Hillside Ave
- 70 Gerard Rd
Your Personal Tour Guide
Ask me questions while you tour the home.