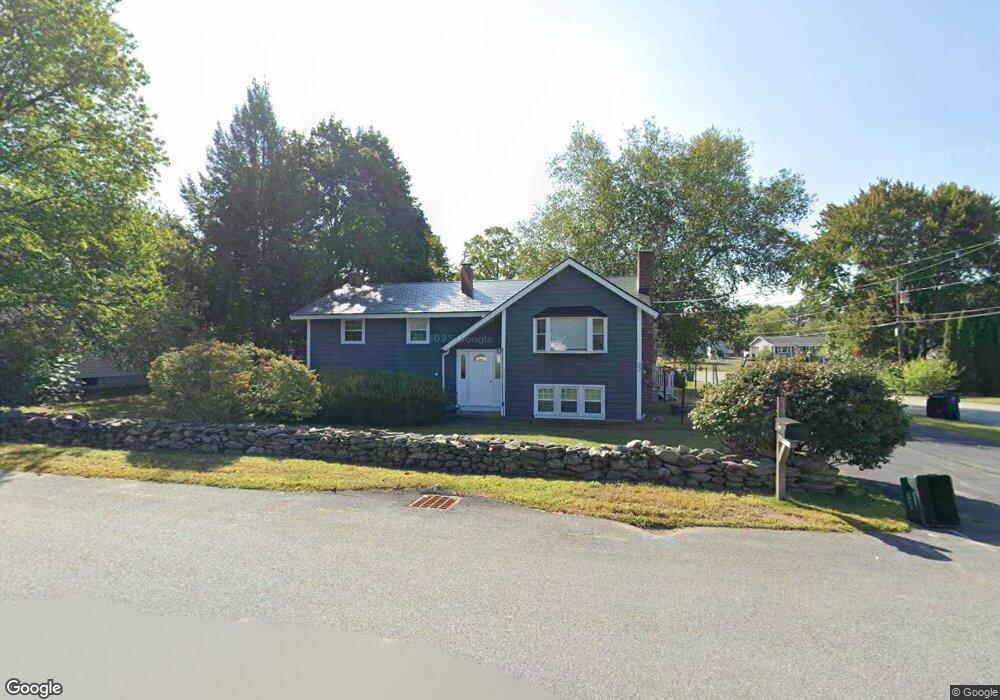
32 Richmond St Nashua, NH 03063
Northwest Nashua NeighborhoodEstimated Value: $482,000 - $508,000
3
Beds
2
Baths
1,038
Sq Ft
$482/Sq Ft
Est. Value
About This Home
This home is located at 32 Richmond St, Nashua, NH 03063 and is currently estimated at $500,288, approximately $481 per square foot. 32 Richmond St is a home located in Hillsborough County with nearby schools including Broad Street Elementary School, Elm Street Middle School, and Nashua High School North.
Ownership History
Date
Name
Owned For
Owner Type
Purchase Details
Closed on
Aug 24, 2001
Sold by
Lyons Thomas F and Lyons Sharon J
Bought by
Vanderbeck Robert J and Vanderbeck Sue A
Current Estimated Value
Home Financials for this Owner
Home Financials are based on the most recent Mortgage that was taken out on this home.
Original Mortgage
$182,550
Interest Rate
7.21%
Mortgage Type
Purchase Money Mortgage
Create a Home Valuation Report for This Property
The Home Valuation Report is an in-depth analysis detailing your home's value as well as a comparison with similar homes in the area
Home Values in the Area
Average Home Value in this Area
Purchase History
| Date | Buyer | Sale Price | Title Company |
|---|---|---|---|
| Vanderbeck Robert J | $184,100 | -- |
Source: Public Records
Mortgage History
| Date | Status | Borrower | Loan Amount |
|---|---|---|---|
| Open | Vanderbeck Robert J | $192,300 | |
| Closed | Vanderbeck Robert J | $50,000 | |
| Closed | Vanderbeck Robert J | $212,000 | |
| Closed | Vanderbeck Robert J | $182,550 |
Source: Public Records
Tax History Compared to Growth
Tax History
| Year | Tax Paid | Tax Assessment Tax Assessment Total Assessment is a certain percentage of the fair market value that is determined by local assessors to be the total taxable value of land and additions on the property. | Land | Improvement |
|---|---|---|---|---|
| 2024 | $7,196 | $452,600 | $159,800 | $292,800 |
| 2023 | $6,765 | $371,100 | $127,800 | $243,300 |
| 2022 | $6,706 | $371,100 | $127,800 | $243,300 |
| 2021 | $5,981 | $257,600 | $85,200 | $172,400 |
| 2020 | $5,838 | $258,200 | $85,200 | $173,000 |
| 2019 | $5,618 | $258,200 | $85,200 | $173,000 |
| 2018 | $5,476 | $258,200 | $85,200 | $173,000 |
| 2017 | $5,473 | $212,200 | $69,600 | $142,600 |
| 2016 | $5,320 | $212,200 | $69,600 | $142,600 |
| 2015 | $5,205 | $212,200 | $69,600 | $142,600 |
| 2014 | $5,103 | $212,200 | $69,600 | $142,600 |
Source: Public Records
Map
Nearby Homes
- 76 Bartemus Trail Unit U231
- 3 Richmond St
- 4 Nelson St
- 27 Country Hill Rd Unit U90
- 46 Scenic Dr
- 11 Bartemus Trail Unit 204
- 5 Meghan Dr Unit U23
- 6 Cornwall Ln Unit 7
- 22 Cathedral Cir
- 334 Broad St
- 20 Martha St
- 14 Parrish Hill Dr
- 40 Spring Cove Rd Unit U117
- 599 W Hollis St
- 11 Inca Dr
- 12 Spring Cove Rd Unit U103
- 424 Broad St
- 4 Chesapeake Rd
- 47 Dogwood Dr Unit U202
- 16 Laurel Ct Unit U320