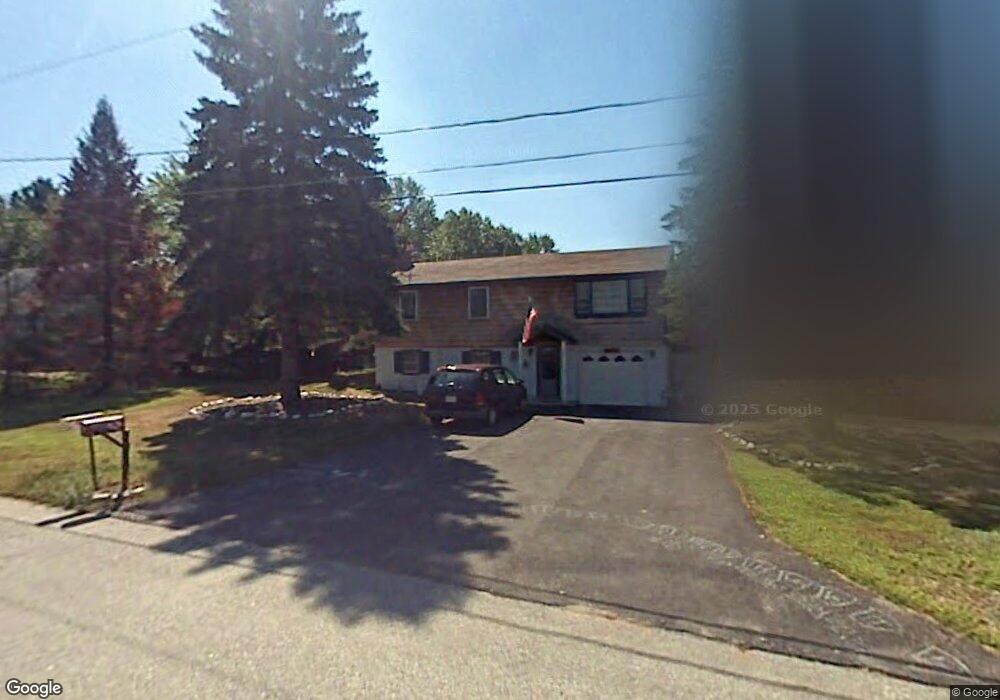
32 Royal Cir Salem, NH 03079
Salem Center NeighborhoodEstimated Value: $515,000 - $553,000
3
Beds
1
Bath
1,104
Sq Ft
$485/Sq Ft
Est. Value
About This Home
This home is located at 32 Royal Cir, Salem, NH 03079 and is currently estimated at $535,389, approximately $484 per square foot. 32 Royal Cir is a home located in Rockingham County with nearby schools including William E. Lancaster School, Woodbury School, and Salem High School.
Ownership History
Date
Name
Owned For
Owner Type
Purchase Details
Closed on
May 13, 2002
Sold by
Naylor Michael J and Naylor Karen A
Bought by
Nickerson Thomas G and Nickerson Alyssa J
Current Estimated Value
Home Financials for this Owner
Home Financials are based on the most recent Mortgage that was taken out on this home.
Original Mortgage
$190,900
Interest Rate
7.18%
Mortgage Type
Purchase Money Mortgage
Create a Home Valuation Report for This Property
The Home Valuation Report is an in-depth analysis detailing your home's value as well as a comparison with similar homes in the area
Home Values in the Area
Average Home Value in this Area
Purchase History
| Date | Buyer | Sale Price | Title Company |
|---|---|---|---|
| Nickerson Thomas G | $201,000 | -- |
Source: Public Records
Mortgage History
| Date | Status | Borrower | Loan Amount |
|---|---|---|---|
| Open | Nickerson Thomas G | $246,232 | |
| Closed | Nickerson Thomas G | $245,883 | |
| Closed | Nickerson Thomas G | $44,000 | |
| Closed | Nickerson Thomas G | $190,900 |
Source: Public Records
Tax History Compared to Growth
Tax History
| Year | Tax Paid | Tax Assessment Tax Assessment Total Assessment is a certain percentage of the fair market value that is determined by local assessors to be the total taxable value of land and additions on the property. | Land | Improvement |
|---|---|---|---|---|
| 2024 | $6,702 | $380,800 | $155,900 | $224,900 |
| 2023 | $6,428 | $379,000 | $155,900 | $223,100 |
| 2022 | $6,083 | $379,000 | $155,900 | $223,100 |
| 2021 | $6,056 | $379,000 | $155,900 | $223,100 |
| 2020 | $5,424 | $246,300 | $111,200 | $135,100 |
| 2019 | $5,414 | $246,300 | $111,200 | $135,100 |
| 2018 | $5,323 | $246,300 | $111,200 | $135,100 |
| 2017 | $5,133 | $246,300 | $111,200 | $135,100 |
| 2016 | $5,032 | $246,300 | $111,200 | $135,100 |
| 2015 | $4,826 | $225,600 | $116,400 | $109,200 |
| 2014 | $4,690 | $225,600 | $116,400 | $109,200 |
| 2013 | $4,616 | $225,600 | $116,400 | $109,200 |
Source: Public Records
Map
Nearby Homes
- 4 Therriault Ave
- 8 Alta Ave
- 49 Millville St
- 89 End St
- 55A Millville Cir
- 11 Sullivan Ct
- 30 Scotland Ave
- 10 Sally Sweets Way Unit V104
- 17 Clinton St
- 27 General Pulaski Dr
- 6 Douglas Dr
- 51 Bluff St
- 1 Kimball Ave
- 8 Arcadia Ln
- 75 S Policy St Unit 45
- 75 S Policy St Unit 48
- 12 Braemoor Woods Rd Unit 206
- 20 Stanwood Rd
- 51 Zion Hill Rd
- 40 Stanwood Rd Unit 9
- 34 Royal Cir
- 30 Royal Cir
- 48 Centerville Dr
- 46 Centerville Dr
- 50 Centerville Dr
- 39 Royal Cir
- 37 Royal Cir
- 36 Royal Cir
- 26 Royal Cir
- 41 Royal Cir
- 44 Centerville Dr
- 52 Centerville Dr
- 43 Royal Cir
- 35 Royal Cir
- 35 Royal Cir Unit 1
- 38 Royal Cir
- 41 Centerville Dr
- 45 Centerville Dr
- 43 Centerville Dr
- 42 Centerville Dr