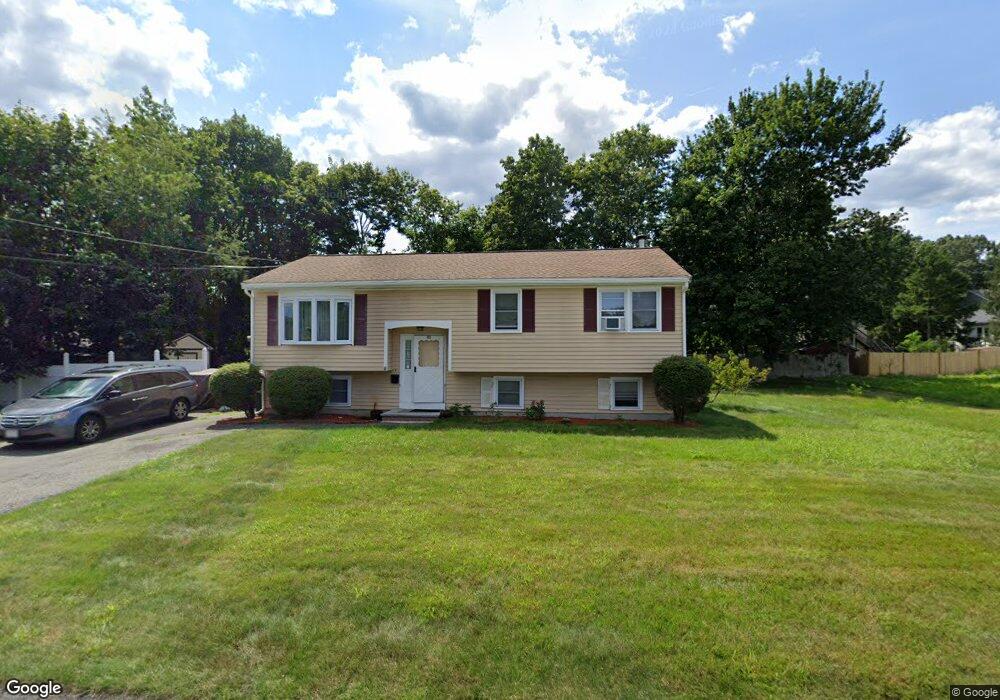
32 Russell Rd Brockton, MA 02302
Estimated Value: $437,000 - $577,000
3
Beds
1
Bath
1,584
Sq Ft
$321/Sq Ft
Est. Value
About This Home
This home is located at 32 Russell Rd, Brockton, MA 02302 and is currently estimated at $509,052, approximately $321 per square foot. 32 Russell Rd is a home located in Plymouth County with nearby schools including Brookfield Elementary School, Mary E. Baker Elementary School, and Downey Elementary School.
Ownership History
Date
Name
Owned For
Owner Type
Purchase Details
Closed on
Jul 15, 1999
Sold by
Fhlmc
Bought by
Edmond Andre A and Edmond Josee
Current Estimated Value
Purchase Details
Closed on
Jun 14, 1999
Sold by
Souza Bruce K and Souza Fhlmc
Bought by
Fhlmc
Purchase Details
Closed on
Feb 13, 1989
Sold by
Construc Briarwood
Bought by
Souza Bruce K
Create a Home Valuation Report for This Property
The Home Valuation Report is an in-depth analysis detailing your home's value as well as a comparison with similar homes in the area
Purchase History
| Date | Buyer | Sale Price | Title Company |
|---|---|---|---|
| Edmond Andre A | $139,900 | -- | |
| Fhlmc | $120,300 | -- | |
| Souza Bruce K | $160,000 | -- |
Source: Public Records
Mortgage History
| Date | Status | Borrower | Loan Amount |
|---|---|---|---|
| Open | Souza Bruce K | $140,000 | |
| Closed | Souza Bruce K | $140,700 | |
| Closed | Souza Bruce K | $134,261 |
Source: Public Records
Tax History
| Year | Tax Paid | Tax Assessment Tax Assessment Total Assessment is a certain percentage of the fair market value that is determined by local assessors to be the total taxable value of land and additions on the property. | Land | Improvement |
|---|---|---|---|---|
| 2025 | $5,500 | $454,200 | $164,500 | $289,700 |
| 2024 | $5,223 | $434,500 | $164,500 | $270,000 |
| 2023 | $5,123 | $394,700 | $130,800 | $263,900 |
| 2022 | $5,292 | $378,800 | $119,500 | $259,300 |
| 2021 | $4,855 | $334,800 | $107,400 | $227,400 |
| 2020 | $4,597 | $303,400 | $102,800 | $200,600 |
| 2019 | $4,376 | $281,600 | $95,500 | $186,100 |
| 2018 | $4,280 | $266,500 | $95,500 | $171,000 |
| 2017 | $3,928 | $244,000 | $95,500 | $148,500 |
| 2016 | $3,988 | $229,700 | $92,200 | $137,500 |
| 2015 | $3,931 | $216,600 | $92,200 | $124,400 |
| 2014 | $3,844 | $212,000 | $92,200 | $119,800 |
Source: Public Records
Map
Nearby Homes
- 2 Dundee St
- 34 Guild Rd
- 111 Ames Rd
- 43 Pinehurst Ave
- 383 Quincy St
- 82 Debbie Rd Unit Lot 18
- 76 Short St
- 35 Errol Rd
- 963 Court St
- 51 Sterling Rd
- 5 Debbie Rd
- 95 Royal Rd
- 40 Austin Ct Unit Lot 3
- 104 Crestfield Dr
- 36 Crestfield Dr
- 101 Regent Rd
- 22 Eames Ave
- 877 Brockton Ave Unit 877
- 854 Brockton Ave
- 151 Windsor Dr
Your Personal Tour Guide
Ask me questions while you tour the home.