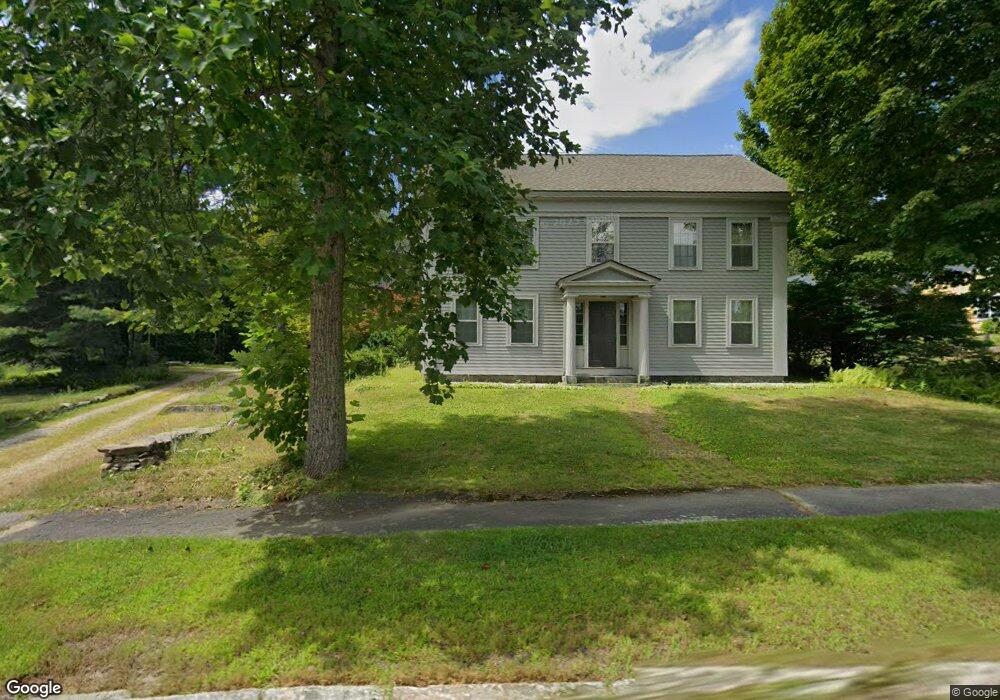
32 S Main St Petersham, MA 01366
Estimated Value: $448,000 - $523,000
3
Beds
2
Baths
2,601
Sq Ft
$184/Sq Ft
Est. Value
About This Home
This home is located at 32 S Main St, Petersham, MA 01366 and is currently estimated at $477,644, approximately $183 per square foot. 32 S Main St is a home located in Worcester County with nearby schools including Petersham Center, Ralph C Mahar Regional, and Petersham Montessori School.
Ownership History
Date
Name
Owned For
Owner Type
Purchase Details
Closed on
May 27, 1983
Bought by
Tomlin C Dana and Tomlin Sandra M
Current Estimated Value
Create a Home Valuation Report for This Property
The Home Valuation Report is an in-depth analysis detailing your home's value as well as a comparison with similar homes in the area
Home Values in the Area
Average Home Value in this Area
Purchase History
| Date | Buyer | Sale Price | Title Company |
|---|---|---|---|
| Tomlin C Dana | $75,000 | -- |
Source: Public Records
Mortgage History
| Date | Status | Borrower | Loan Amount |
|---|---|---|---|
| Open | Tomlin C Dana | $241,500 | |
| Closed | Tomlin C Dana | $75,000 | |
| Closed | Tomlin C Dana | $237,500 | |
| Closed | Tomlin C Dana | $64,500 |
Source: Public Records
Tax History Compared to Growth
Tax History
| Year | Tax Paid | Tax Assessment Tax Assessment Total Assessment is a certain percentage of the fair market value that is determined by local assessors to be the total taxable value of land and additions on the property. | Land | Improvement |
|---|---|---|---|---|
| 2025 | $5,666 | $391,000 | $55,300 | $335,700 |
| 2024 | $4,988 | $348,800 | $55,300 | $293,500 |
| 2023 | $4,420 | $279,900 | $52,700 | $227,200 |
| 2022 | $3,790 | $279,900 | $52,700 | $227,200 |
| 2021 | $4,100 | $267,800 | $47,900 | $219,900 |
| 2020 | $4,320 | $248,700 | $41,500 | $207,200 |
| 2019 | $4,151 | $245,200 | $36,400 | $208,800 |
| 2018 | $3,991 | $243,800 | $35,000 | $208,800 |
| 2017 | $3,962 | $244,700 | $37,300 | $207,400 |
| 2016 | $4,018 | $244,700 | $37,300 | $207,400 |
| 2015 | $4,120 | $242,500 | $37,300 | $205,200 |
| 2014 | $3,863 | $242,500 | $37,300 | $205,200 |
Source: Public Records
Map
Nearby Homes
- 15 Common St
- 42 New Salem Rd
- 19&21 Common St
- 32 West St
- 163 Hardwick Rd
- 27 Popple Camp Rd
- 0 Popple Camp Rd Unit 73432026
- 42 Glasheen Rd
- 204 East St
- 0 Nichewaug Rd
- 11-L New Athol Rd
- 12-L New Athol Rd
- 7-L New Athol Rd
- 47 Harty Dr
- 32 Edward Ln
- 31 Edward Ln
- 37 Gauthier Rd
- 20 Dana Rd
- 30 Woodward Rd
- 0 Carter Pond Rd