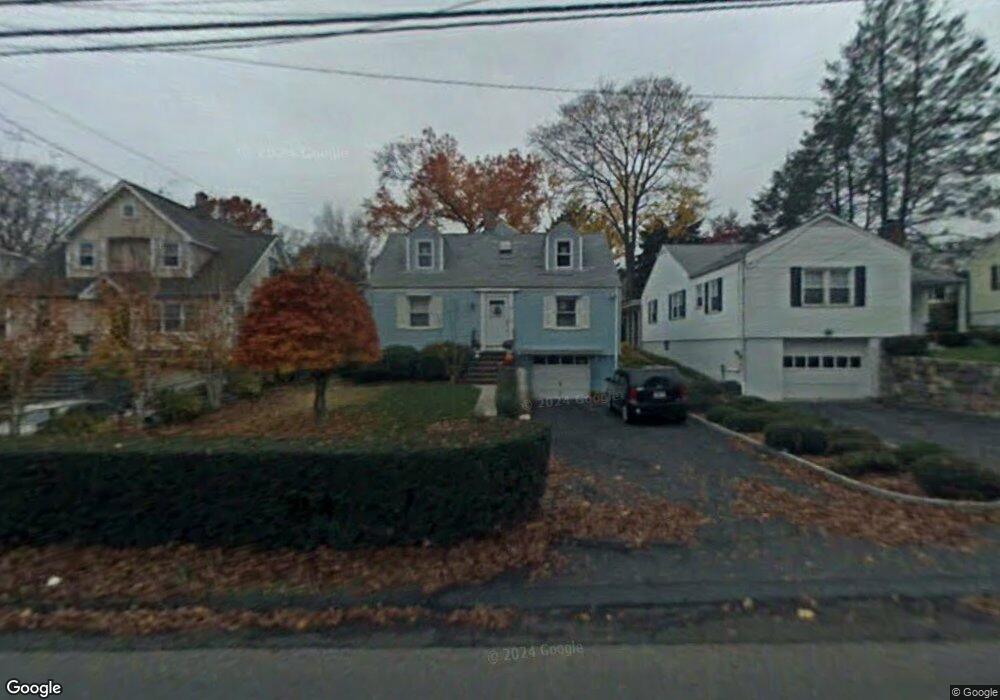
32 Sheephill Rd Riverside, CT 06878
Estimated Value: $916,000 - $1,174,000
3
Beds
3
Baths
1,274
Sq Ft
$833/Sq Ft
Est. Value
About This Home
This home is located at 32 Sheephill Rd, Riverside, CT 06878 and is currently estimated at $1,060,852, approximately $832 per square foot. 32 Sheephill Rd is a home located in Fairfield County with nearby schools including Cos Cob School, Central Middle School, and Greenwich High School.
Ownership History
Date
Name
Owned For
Owner Type
Purchase Details
Closed on
Aug 9, 2010
Sold by
Deustsche Bank Natl T
Bought by
Jones Craig R
Current Estimated Value
Home Financials for this Owner
Home Financials are based on the most recent Mortgage that was taken out on this home.
Original Mortgage
$25,000
Interest Rate
4.73%
Purchase Details
Closed on
Apr 9, 2010
Sold by
One West Bk
Bought by
Deutsche Bank Natl T C
Purchase Details
Closed on
Apr 1, 2010
Sold by
Zafe-Lumbao Levina B
Bought by
One West Bk
Purchase Details
Closed on
Feb 23, 2007
Sold by
Galesky Rosa Gr
Bought by
Zafe-Lumbao Levina B
Home Financials for this Owner
Home Financials are based on the most recent Mortgage that was taken out on this home.
Original Mortgage
$577,520
Interest Rate
7.5%
Purchase Details
Closed on
Jun 22, 2005
Sold by
Iovanna Joan A
Bought by
Galesky Rosa G R
Create a Home Valuation Report for This Property
The Home Valuation Report is an in-depth analysis detailing your home's value as well as a comparison with similar homes in the area
Home Values in the Area
Average Home Value in this Area
Purchase History
| Date | Buyer | Sale Price | Title Company |
|---|---|---|---|
| Jones Craig R | $510,000 | -- | |
| Deutsche Bank Natl T C | -- | -- | |
| One West Bk | -- | -- | |
| Zafe-Lumbao Levina B | $721,900 | -- | |
| Galesky Rosa G R | $695,000 | -- |
Source: Public Records
Mortgage History
| Date | Status | Borrower | Loan Amount |
|---|---|---|---|
| Open | Galesky Rosa G R | $350,000 | |
| Closed | Galesky Rosa G R | $25,000 | |
| Previous Owner | Galesky Rosa G R | $577,520 |
Source: Public Records
Tax History
| Year | Tax Paid | Tax Assessment Tax Assessment Total Assessment is a certain percentage of the fair market value that is determined by local assessors to be the total taxable value of land and additions on the property. | Land | Improvement |
|---|---|---|---|---|
| 2025 | $6,215 | $502,880 | $395,080 | $107,800 |
| 2024 | $6,002 | $502,880 | $395,080 | $107,800 |
| 2023 | $5,852 | $502,880 | $395,080 | $107,800 |
| 2022 | $5,798 | $502,880 | $395,080 | $107,800 |
| 2021 | $5,626 | $467,250 | $353,150 | $114,100 |
| 2020 | $5,616 | $467,250 | $353,150 | $114,100 |
| 2019 | $5,672 | $467,250 | $353,150 | $114,100 |
| 2018 | $5,465 | $460,390 | $353,150 | $107,240 |
| 2017 | $5,533 | $460,390 | $353,150 | $107,240 |
| 2016 | $5,446 | $460,390 | $353,150 | $107,240 |
| 2015 | $4,959 | $415,870 | $354,060 | $61,810 |
| 2014 | $4,834 | $415,870 | $354,060 | $61,810 |
Source: Public Records
Map
Nearby Homes
- 23 Westview Place
- 45 Sound Beach Avenue Extension
- 48 Meyer Place
- 25 Dialstone Ln
- 18 Griffith Rd
- 45 Sunshine Ave
- 115 River Rd Unit 7
- 112 Sheephill Rd
- 20 Sound Beach Ave
- 18 Sound Beach Ave
- 29 Sound Beach Ave
- 24 Harold St Unit E
- 11 Bible St
- 24 Valley Rd
- 10 Verona Dr
- 17 Maple Dr
- 1465 E Putnam Ave Unit 306
- 47 Owenoke Way
- 4 Miami Ct
- 63 Wesskum Wood Rd
- 34 Sheephill Rd
- 30 Sheephill Rd
- 26 Sheephill Rd
- 36 Sheephill Rd
- 23 Spezzano Dr
- 21 Spezzano Dr
- 25 Spezzano Dr
- 38 Sheephill Rd
- 24 Sheephill Rd
- 19 Spezzano Dr
- 27 Spezzano Dr
- 31 Sheephill Rd
- 29 Sheephill Rd
- 29 Sheephill Rd Unit 1
- 33 Sheephill Rd
- 29 Spezzano Dr
- 17 Spezzano Dr
- 40 Sheephill Rd
- 22 Sheephill Rd
- 27 Sheephill Rd
Your Personal Tour Guide
Ask me questions while you tour the home.