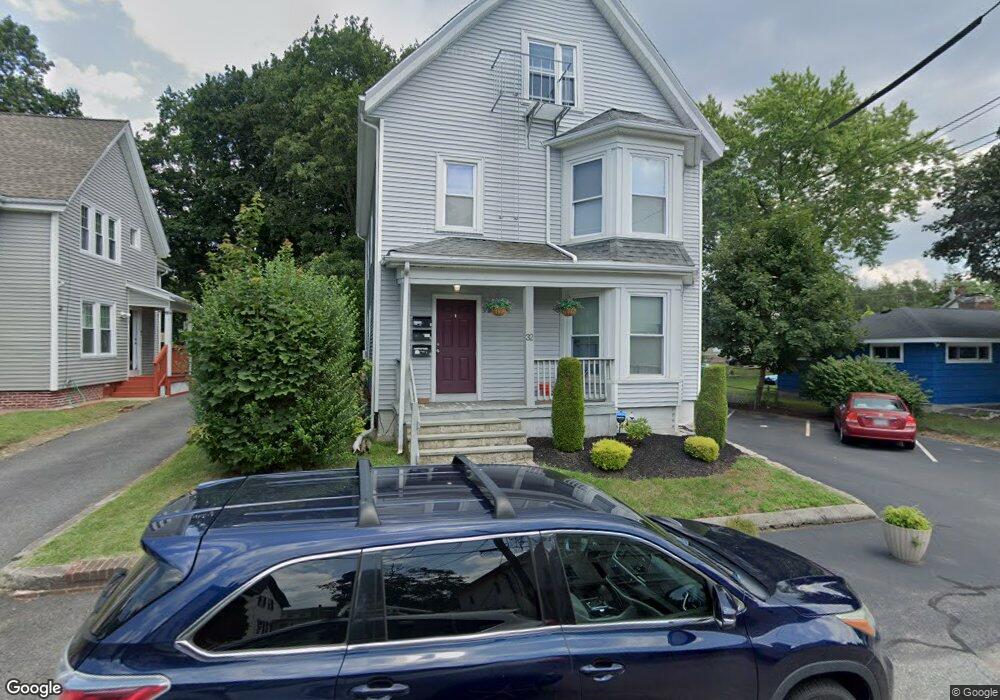
32 Smith Ave Brockton, MA 02302
Clifton Heights NeighborhoodEstimated Value: $611,000 - $795,000
5
Beds
3
Baths
2,638
Sq Ft
$268/Sq Ft
Est. Value
About This Home
This home is located at 32 Smith Ave, Brockton, MA 02302 and is currently estimated at $705,667, approximately $267 per square foot. 32 Smith Ave is a home located in Plymouth County with nearby schools including Gilmore Elementary School, Davis K-8 School, and John F. Kennedy Elementary School.
Ownership History
Date
Name
Owned For
Owner Type
Purchase Details
Closed on
Oct 1, 2010
Sold by
32 Smith Avenue Rt
Bought by
Lincoln Chad M
Current Estimated Value
Home Financials for this Owner
Home Financials are based on the most recent Mortgage that was taken out on this home.
Original Mortgage
$135,000
Outstanding Balance
$89,614
Interest Rate
4.39%
Estimated Equity
$616,053
Purchase Details
Closed on
May 20, 2010
Sold by
Lincoln Chad M
Bought by
32 Smith Avenue Rt
Purchase Details
Closed on
Jun 9, 2008
Sold by
Forte Glenn
Bought by
Lincoln Chad M
Purchase Details
Closed on
Aug 2, 2000
Sold by
Santos Lilia E and Forte Glenn
Bought by
Forte Glenn
Purchase Details
Closed on
Dec 16, 1993
Sold by
Paul Catherine N
Bought by
Santos Lilia E
Create a Home Valuation Report for This Property
The Home Valuation Report is an in-depth analysis detailing your home's value as well as a comparison with similar homes in the area
Home Values in the Area
Average Home Value in this Area
Purchase History
| Date | Buyer | Sale Price | Title Company |
|---|---|---|---|
| Lincoln Chad M | -- | -- | |
| 32 Smith Avenue Rt | -- | -- | |
| Lincoln Chad M | $90,000 | -- | |
| Forte Glenn | $58,000 | -- | |
| Santos Lilia E | $61,834 | -- |
Source: Public Records
Mortgage History
| Date | Status | Borrower | Loan Amount |
|---|---|---|---|
| Open | Santos Lilia E | $135,000 | |
| Previous Owner | Santos Lilia E | $150,000 | |
| Previous Owner | Santos Lilia E | $150,000 |
Source: Public Records
Tax History
| Year | Tax Paid | Tax Assessment Tax Assessment Total Assessment is a certain percentage of the fair market value that is determined by local assessors to be the total taxable value of land and additions on the property. | Land | Improvement |
|---|---|---|---|---|
| 2025 | $7,930 | $654,800 | $140,100 | $514,700 |
| 2024 | $7,375 | $613,600 | $140,100 | $473,500 |
| 2023 | $7,218 | $556,100 | $104,400 | $451,700 |
| 2022 | $7,270 | $520,400 | $94,900 | $425,500 |
| 2021 | $6,347 | $437,700 | $78,800 | $358,900 |
| 2020 | $5,536 | $365,400 | $73,800 | $291,600 |
| 2019 | $5,540 | $356,500 | $72,000 | $284,500 |
| 2018 | $4,821 | $300,200 | $72,000 | $228,200 |
| 2017 | $4,624 | $287,200 | $72,000 | $215,200 |
| 2016 | $4,154 | $239,300 | $69,800 | $169,500 |
| 2015 | $3,597 | $198,200 | $69,800 | $128,400 |
| 2014 | $3,303 | $182,200 | $69,800 | $112,400 |
Source: Public Records
Map
Nearby Homes
Your Personal Tour Guide
Ask me questions while you tour the home.