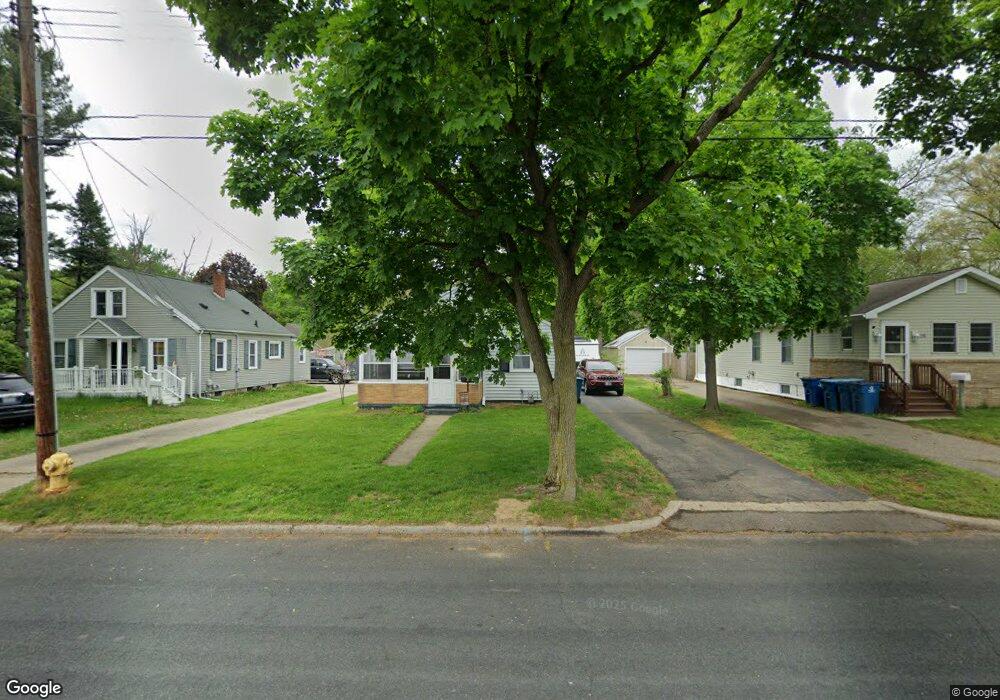
32 Spaulding Ave W Battle Creek, MI 49037
Urbandale NeighborhoodEstimated Value: $137,000 - $150,000
3
Beds
1
Bath
864
Sq Ft
$166/Sq Ft
Est. Value
About This Home
This home is located at 32 Spaulding Ave W, Battle Creek, MI 49037 and is currently estimated at $143,814, approximately $166 per square foot. 32 Spaulding Ave W is a home located in Calhoun County with nearby schools including Northwestern Middle School, Battle Creek Central High School, and Endeavor Charter Academy.
Ownership History
Date
Name
Owned For
Owner Type
Purchase Details
Closed on
Jan 4, 2021
Sold by
Nelson Pamela S and Wills Sindey J
Bought by
Nelson Pamela S
Current Estimated Value
Home Financials for this Owner
Home Financials are based on the most recent Mortgage that was taken out on this home.
Original Mortgage
$55,000
Outstanding Balance
$40,123
Interest Rate
2.6%
Mortgage Type
New Conventional
Estimated Equity
$103,691
Purchase Details
Closed on
Apr 13, 2009
Sold by
Nelson Pamela S
Bought by
Nelson Pamela S and Wills Sindey J
Home Financials for this Owner
Home Financials are based on the most recent Mortgage that was taken out on this home.
Original Mortgage
$54,000
Interest Rate
5.05%
Mortgage Type
New Conventional
Purchase Details
Closed on
Jun 12, 2007
Sold by
Holcomb Patti Lynn and Estate Of Kenneth S Kelley
Bought by
Nelson Pamela S
Purchase Details
Closed on
Feb 12, 2002
Sold by
Kelley Martha Jo
Create a Home Valuation Report for This Property
The Home Valuation Report is an in-depth analysis detailing your home's value as well as a comparison with similar homes in the area
Home Values in the Area
Average Home Value in this Area
Purchase History
| Date | Buyer | Sale Price | Title Company |
|---|---|---|---|
| Nelson Pamela S | -- | None Available | |
| Nelson Pamela S | -- | Calhoun Title & Escrow Agenc | |
| Nelson Pamela S | $70,000 | None Available | |
| -- | -- | -- |
Source: Public Records
Mortgage History
| Date | Status | Borrower | Loan Amount |
|---|---|---|---|
| Open | Nelson Pamela S | $55,000 | |
| Closed | Nelson Pamela S | $54,000 |
Source: Public Records
Tax History Compared to Growth
Tax History
| Year | Tax Paid | Tax Assessment Tax Assessment Total Assessment is a certain percentage of the fair market value that is determined by local assessors to be the total taxable value of land and additions on the property. | Land | Improvement |
|---|---|---|---|---|
| 2025 | -- | $50,700 | $0 | $0 |
| 2024 | $853 | $47,377 | $0 | $0 |
| 2023 | $975 | $38,721 | $0 | $0 |
| 2022 | $771 | $32,192 | $0 | $0 |
| 2021 | $920 | $29,531 | $0 | $0 |
| 2020 | $911 | $29,712 | $0 | $0 |
| 2019 | $865 | $29,438 | $0 | $0 |
| 2018 | $865 | $27,245 | $875 | $26,370 |
| 2017 | $836 | $25,410 | $0 | $0 |
| 2016 | $834 | $21,093 | $0 | $0 |
| 2015 | $884 | $18,015 | $2,456 | $15,559 |
| 2014 | $884 | $19,191 | $2,456 | $16,735 |
Source: Public Records
Map
Nearby Homes
- 33 Shellenberger Ave
- 40 Kellogg St
- 81 Taylor Ave
- 163 Spaulding Ave W
- 1528 Michigan Ave W
- 116 Geneva Ave
- 137 Dunning Ave
- 134 Willard Ave E
- 35 Avery Ave
- 91 Mosher Ave
- 51 Dunning Ave
- 0 Bynum Drive Lots 29 & 30 Dr Unit 25025910
- 133 Mosher Ave
- 134 Creekview Dr
- 213 Broadway Blvd
- 180 Woodlawn Ave N
- 217 Creekview Dr
- 232 Woodlawn Ave N
- 244 Woodlawn Ave N
- 33 Mason Ave N
- 28 Spaulding Ave W
- 40 Spaulding Ave W
- 37 Spaulding Ave W
- 16 Spaulding Ave W
- 27 W Spaulding Ave
- 43 Spaulding Ave W
- 37 E Spaulding Ave
- 19 Spaulding Ave W
- 31 Spaulding Ave W
- 19 W Spaulding Ave
- 37 Shellenberger Ave
- 12 Spaulding Ave W
- 52 Spaulding Ave W
- 29 Shellenberger Ave
- 43 Shellenberger Ave
- 25 Shellenberger Ave
- 17 Spaulding Ave W
- 56 Spaulding Ave W
- 19 Shellenberger Ave
- 177 Bedford Rd N