A
Seller's Agent in 2021
Amanda Reichert
Allison James Estates and Homes
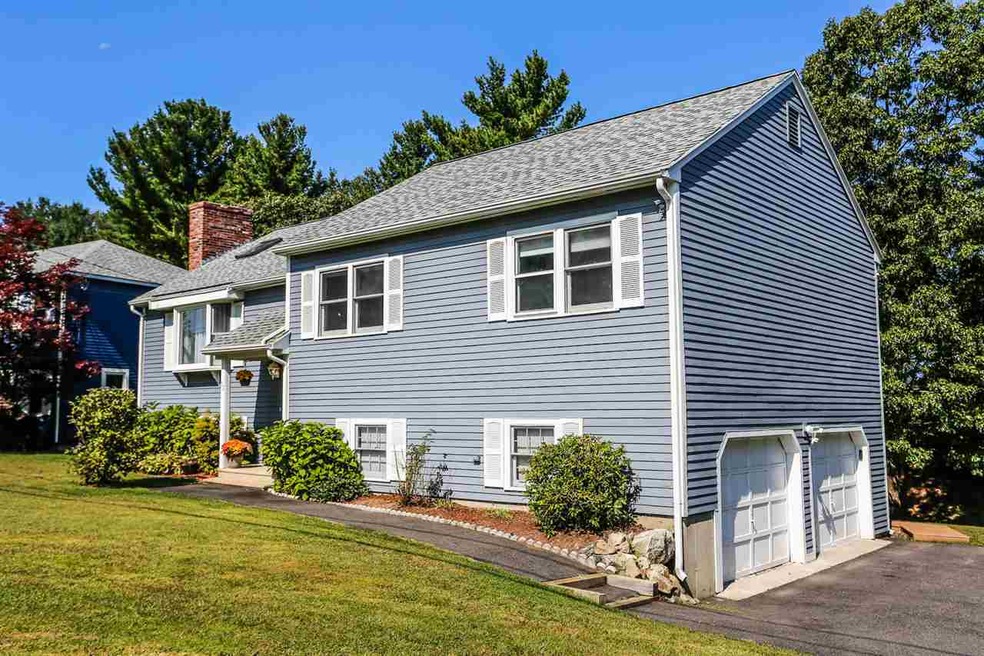
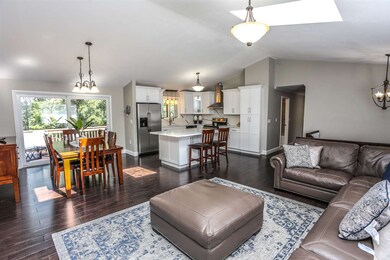
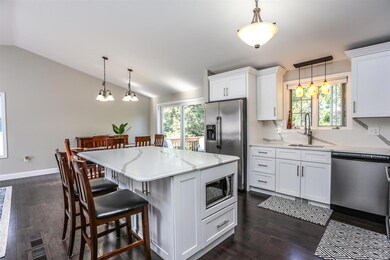
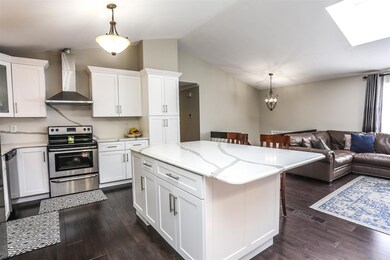
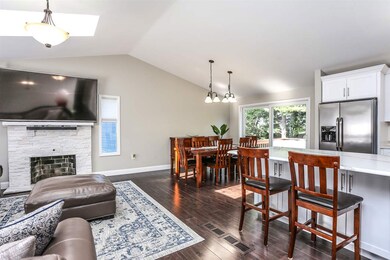
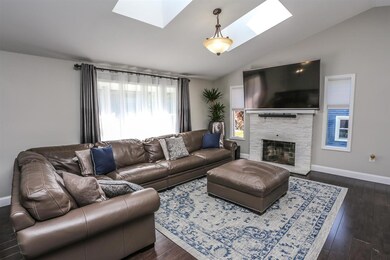
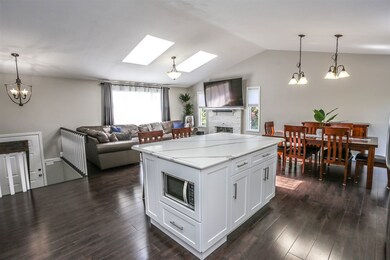
Stunning single family property in desirable South Nashua location. This amazing residence features high cathedral ceilings, an open floor plan, central A/C, gleaming wood floors, great flow & space. This sun filled house features 3 bedrooms, 3 completely renovated bathrooms, finished basement, a 2 car garage and a gorgeous new gourmet kitchen with one of a kind modern quartz and stainless steel appliances. Welcome home to this beautiful move in condition house, all you need to do is unpack and enjoy!
Last Agent to Sell the Property
Albert Invest Realty Group License #071819 Listed on: 09/15/2017
| Date | Type | Sale Price | Title Company |
|---|---|---|---|
| Warranty Deed | $475,000 | None Available | |
| Warranty Deed | $475,000 | None Available | |
| Warranty Deed | $393,000 | -- | |
| Warranty Deed | $376,000 | -- | |
| Warranty Deed | $376,000 | -- | |
| Not Resolvable | $280,000 | -- | |
| Foreclosure Deed | $201,000 | -- | |
| Foreclosure Deed | $201,000 | -- | |
| Deed | $349,900 | -- | |
| Deed | $349,900 | -- |
| Date | Status | Loan Amount | Loan Type |
|---|---|---|---|
| Open | $403,750 | Purchase Money Mortgage | |
| Closed | $403,750 | Purchase Money Mortgage | |
| Previous Owner | $373,350 | No Value Available | |
| Previous Owner | $200,000 | No Value Available | |
| Previous Owner | $266,000 | Unknown | |
| Previous Owner | $69,980 | Purchase Money Mortgage |
| Date | Event | Price | Change | Sq Ft Price |
|---|---|---|---|---|
| 01/14/2021 01/14/21 | Sold | $475,000 | -1.7% | $247 / Sq Ft |
| 11/26/2020 11/26/20 | Pending | -- | -- | -- |
| 11/19/2020 11/19/20 | For Sale | $483,000 | +22.9% | $251 / Sq Ft |
| 08/23/2019 08/23/19 | Sold | $393,000 | -1.7% | $196 / Sq Ft |
| 07/28/2019 07/28/19 | Pending | -- | -- | -- |
| 07/23/2019 07/23/19 | For Sale | $399,900 | +6.4% | $200 / Sq Ft |
| 10/18/2017 10/18/17 | Sold | $376,000 | -1.0% | $289 / Sq Ft |
| 09/15/2017 09/15/17 | For Sale | $379,900 | -- | $292 / Sq Ft |
| Year | Tax Paid | Tax Assessment Tax Assessment Total Assessment is a certain percentage of the fair market value that is determined by local assessors to be the total taxable value of land and additions on the property. | Land | Improvement |
|---|---|---|---|---|
| 2023 | $9,201 | $504,700 | $111,400 | $393,300 |
| 2022 | $9,120 | $504,700 | $111,400 | $393,300 |
| 2021 | $8,663 | $373,100 | $81,700 | $291,400 |
| 2020 | $8,436 | $373,100 | $81,700 | $291,400 |
| 2019 | $7,940 | $364,900 | $81,700 | $283,200 |
| 2018 | $7,740 | $364,900 | $81,700 | $283,200 |
| 2017 | $6,613 | $256,400 | $70,400 | $186,000 |
| 2016 | $6,415 | $255,900 | $70,400 | $185,500 |
| 2015 | $6,277 | $255,900 | $70,400 | $185,500 |
| 2014 | $6,154 | $255,900 | $70,400 | $185,500 |
A
Seller's Agent in 2021
Amanda Reichert
Allison James Estates and Homes

Buyer's Agent in 2021
Suzanne Rosario
Keller Williams Gateway Realty
(603) 209-3269
4 in this area
49 Total Sales
Seller's Agent in 2019
Charlotte Marrocco-Mohler
BHHS Verani Nashua
(603) 620-2668
20 in this area
263 Total Sales
M
Seller's Agent in 2017
Mariana Silva
Albert Invest Realty Group
(603) 438-4263
10 in this area
169 Total Sales
Buyer's Agent in 2017
Missy Adams
Keller Williams Gateway Realty
(603) 320-6368
44 in this area
225 Total Sales
Source: PrimeMLS
MLS Number: 4659339
APN: NASH-000000-000000-002557B
Disclaimer: Certain information contained herein is derived from information provided by parties other than Homes.com. All information provided is deemed reliable, but is not guaranteed to be accurate and should be independently verified.
![]() Copyright 2025 PrimeMLS, Inc. All rights reserved. This information is deemed reliable, but not guaranteed. The data relating to real estate displayed on this display comes in part from the IDX Program of PrimeMLS. The information being provided is for consumers’ personal, non-commercial use and may not be used for any purpose other than to identify prospective properties consumers may be interested in purchasing.
Copyright 2025 PrimeMLS, Inc. All rights reserved. This information is deemed reliable, but not guaranteed. The data relating to real estate displayed on this display comes in part from the IDX Program of PrimeMLS. The information being provided is for consumers’ personal, non-commercial use and may not be used for any purpose other than to identify prospective properties consumers may be interested in purchasing.