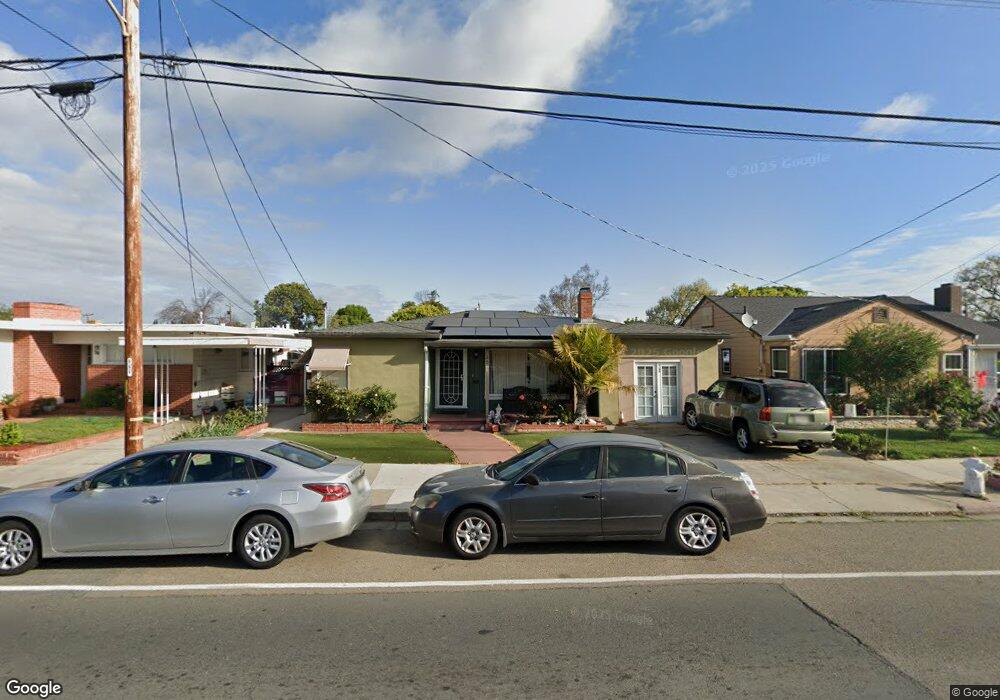
32 W 18th St Antioch, CA 94509
North Antioch NeighborhoodEstimated Value: $431,000 - $491,000
3
Beds
1
Bath
1,045
Sq Ft
$438/Sq Ft
Est. Value
About This Home
This home is located at 32 W 18th St, Antioch, CA 94509 and is currently estimated at $457,610, approximately $437 per square foot. 32 W 18th St is a home located in Contra Costa County with nearby schools including Fremont Elementary School, Antioch Middle School, and Antioch High School.
Ownership History
Date
Name
Owned For
Owner Type
Purchase Details
Closed on
Aug 1, 2006
Sold by
Ramirez Juan C
Bought by
Ramirez Juan C and Ramirez Josefa
Current Estimated Value
Purchase Details
Closed on
May 12, 2006
Sold by
Graziani Rudolph and Graziani Angelina
Bought by
Ramirez Juan C
Home Financials for this Owner
Home Financials are based on the most recent Mortgage that was taken out on this home.
Original Mortgage
$300,000
Outstanding Balance
$246,318
Interest Rate
7.25%
Mortgage Type
Purchase Money Mortgage
Estimated Equity
$211,292
Purchase Details
Closed on
May 9, 2006
Sold by
Ramirez Josefa
Bought by
Ramirez Juan C
Home Financials for this Owner
Home Financials are based on the most recent Mortgage that was taken out on this home.
Original Mortgage
$300,000
Outstanding Balance
$246,318
Interest Rate
7.25%
Mortgage Type
Purchase Money Mortgage
Estimated Equity
$211,292
Purchase Details
Closed on
Nov 12, 2004
Sold by
Mori Frank
Bought by
Mori Frank
Create a Home Valuation Report for This Property
The Home Valuation Report is an in-depth analysis detailing your home's value as well as a comparison with similar homes in the area
Home Values in the Area
Average Home Value in this Area
Purchase History
| Date | Buyer | Sale Price | Title Company |
|---|---|---|---|
| Ramirez Juan C | -- | None Available | |
| Ramirez Juan C | $375,000 | Financial Title Company | |
| Ramirez Juan C | -- | Financial Title Company | |
| Mori Frank | -- | -- |
Source: Public Records
Mortgage History
| Date | Status | Borrower | Loan Amount |
|---|---|---|---|
| Open | Ramirez Juan C | $300,000 |
Source: Public Records
Tax History
| Year | Tax Paid | Tax Assessment Tax Assessment Total Assessment is a certain percentage of the fair market value that is determined by local assessors to be the total taxable value of land and additions on the property. | Land | Improvement |
|---|---|---|---|---|
| 2025 | $5,364 | $435,000 | $348,000 | $87,000 |
| 2024 | $5,163 | $426,000 | $341,000 | $85,000 |
| 2023 | $5,163 | $424,000 | $339,205 | $84,795 |
| 2022 | $5,175 | $424,000 | $339,205 | $84,795 |
| 2021 | $4,382 | $362,000 | $289,604 | $72,396 |
| 2019 | $3,968 | $319,000 | $255,203 | $63,797 |
| 2018 | $3,437 | $277,500 | $222,003 | $55,497 |
| 2017 | $3,088 | $248,500 | $198,802 | $49,698 |
| 2016 | $2,751 | $220,000 | $176,002 | $43,998 |
| 2015 | $2,522 | $199,000 | $159,202 | $39,798 |
| 2014 | $1,868 | $143,500 | $114,801 | $28,699 |
Source: Public Records
Map
Nearby Homes
Your Personal Tour Guide
Ask me questions while you tour the home.