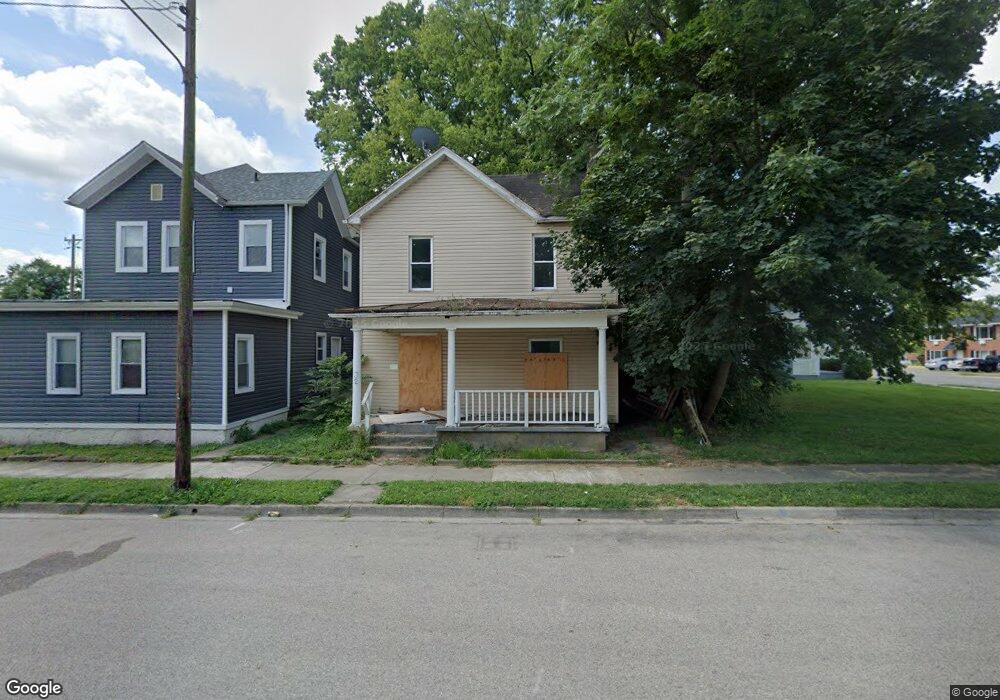
32 W 5th St Franklin, OH 45005
Estimated Value: $95,210 - $160,000
3
Beds
1
Bath
1,344
Sq Ft
$94/Sq Ft
Est. Value
About This Home
This home is located at 32 W 5th St, Franklin, OH 45005 and is currently estimated at $126,053, approximately $93 per square foot. 32 W 5th St is a home located in Warren County with nearby schools including Franklin High School.
Ownership History
Date
Name
Owned For
Owner Type
Purchase Details
Closed on
Aug 28, 2024
Sold by
Townsquare Properties Llc
Bought by
City Of Franklin
Current Estimated Value
Purchase Details
Closed on
May 20, 2024
Sold by
B And B Investments Of Carlisle Llc
Bought by
Town Square Properties Llc
Home Financials for this Owner
Home Financials are based on the most recent Mortgage that was taken out on this home.
Original Mortgage
$53,460
Interest Rate
7.1%
Mortgage Type
New Conventional
Purchase Details
Closed on
Jun 1, 2022
Sold by
Simmons Lanney A and Simmons Lanney A
Bought by
B & B Tin Estments Of Carlisle Llc
Purchase Details
Closed on
May 20, 1986
Sold by
Howell Howell and Howell Alice
Bought by
Lanney Simmons and Lanney A.
Purchase Details
Closed on
Jun 23, 1983
Sold by
Carlson Agnes and Carlson Agnes
Bought by
Howell and Howell Alice
Purchase Details
Closed on
May 14, 1981
Sold by
Jenkins Jenkins and Jenkins Edward
Purchase Details
Closed on
Jul 19, 1979
Sold by
Carlson Carlson and Carlson William O
Create a Home Valuation Report for This Property
The Home Valuation Report is an in-depth analysis detailing your home's value as well as a comparison with similar homes in the area
Home Values in the Area
Average Home Value in this Area
Purchase History
| Date | Buyer | Sale Price | Title Company |
|---|---|---|---|
| City Of Franklin | -- | None Listed On Document | |
| Town Square Properties Llc | $53,460 | None Listed On Document | |
| B & B Tin Estments Of Carlisle Llc | -- | New Title Company Name | |
| Lanney Simmons | $10,000 | -- | |
| Howell | -- | -- | |
| -- | $12,000 | -- | |
| -- | $20,500 | -- |
Source: Public Records
Mortgage History
| Date | Status | Borrower | Loan Amount |
|---|---|---|---|
| Previous Owner | Town Square Properties Llc | $53,460 |
Source: Public Records
Tax History Compared to Growth
Tax History
| Year | Tax Paid | Tax Assessment Tax Assessment Total Assessment is a certain percentage of the fair market value that is determined by local assessors to be the total taxable value of land and additions on the property. | Land | Improvement |
|---|---|---|---|---|
| 2024 | $1,205 | $25,040 | $4,780 | $20,260 |
| 2023 | $1,004 | $18,718 | $2,628 | $16,089 |
| 2022 | $984 | $18,718 | $2,629 | $16,090 |
| 2021 | $972 | $18,718 | $2,629 | $16,090 |
| 2020 | $1,001 | $17,017 | $2,391 | $14,627 |
| 2019 | $915 | $17,017 | $2,391 | $14,627 |
| 2018 | $865 | $17,017 | $2,391 | $14,627 |
| 2017 | $951 | $16,181 | $2,272 | $13,909 |
| 2016 | $930 | $16,181 | $2,272 | $13,909 |
| 2015 | $930 | $16,181 | $2,272 | $13,909 |
| 2014 | $954 | $16,180 | $2,270 | $13,910 |
| 2013 | $812 | $17,030 | $2,390 | $14,640 |
Source: Public Records
Map
Nearby Homes