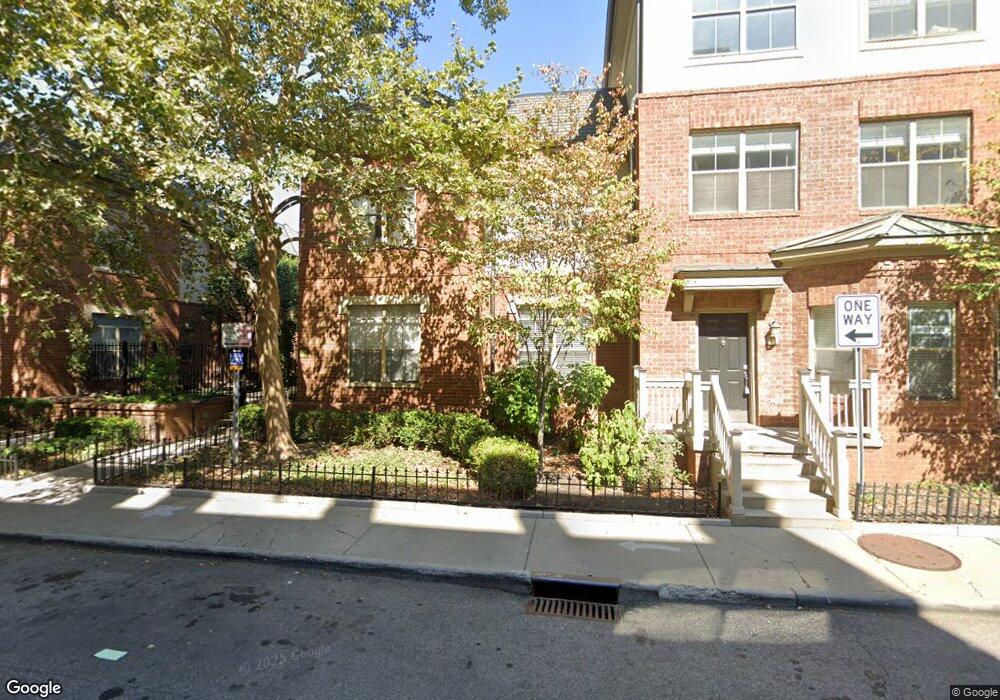
32 W Russell St Columbus, OH 43215
Short North NeighborhoodEstimated Value: $253,000 - $358,000
1
Bed
1
Bath
827
Sq Ft
$347/Sq Ft
Est. Value
About This Home
This home is located at 32 W Russell St, Columbus, OH 43215 and is currently estimated at $286,926, approximately $346 per square foot. 32 W Russell St is a home located in Franklin County with nearby schools including Hubbard Elementary School, Dominion Middle School, and Whetstone High School.
Ownership History
Date
Name
Owned For
Owner Type
Purchase Details
Closed on
Mar 22, 2017
Sold by
Alley Nemjammin L
Bought by
Paul Riobejrt Kuntz If He
Current Estimated Value
Purchase Details
Closed on
Jun 29, 2010
Sold by
Michel Kevin P
Bought by
Alley Benjamin L
Purchase Details
Closed on
Nov 1, 2005
Sold by
Victorian Gate Conversion Co Llc
Bought by
Michel Kevin P
Home Financials for this Owner
Home Financials are based on the most recent Mortgage that was taken out on this home.
Original Mortgage
$118,844
Interest Rate
7.5%
Mortgage Type
Purchase Money Mortgage
Create a Home Valuation Report for This Property
The Home Valuation Report is an in-depth analysis detailing your home's value as well as a comparison with similar homes in the area
Home Values in the Area
Average Home Value in this Area
Purchase History
| Date | Buyer | Sale Price | Title Company |
|---|---|---|---|
| Paul Riobejrt Kuntz If He | -- | None Available | |
| Alley Benjamin L | $164,900 | Title First | |
| Michel Kevin P | $148,600 | Title First |
Source: Public Records
Mortgage History
| Date | Status | Borrower | Loan Amount |
|---|---|---|---|
| Previous Owner | Michel Kevin P | $118,844 |
Source: Public Records
Tax History Compared to Growth
Tax History
| Year | Tax Paid | Tax Assessment Tax Assessment Total Assessment is a certain percentage of the fair market value that is determined by local assessors to be the total taxable value of land and additions on the property. | Land | Improvement |
|---|---|---|---|---|
| 2024 | $4,409 | $93,990 | $24,510 | $69,480 |
| 2023 | $4,358 | $93,990 | $24,510 | $69,480 |
| 2022 | $4,513 | $83,520 | $23,110 | $60,410 |
| 2021 | $4,521 | $83,520 | $23,110 | $60,410 |
| 2020 | $4,515 | $83,520 | $23,110 | $60,410 |
| 2019 | $4,390 | $69,590 | $19,260 | $50,330 |
| 2018 | $4,220 | $69,590 | $19,260 | $50,330 |
| 2017 | $4,417 | $69,590 | $19,260 | $50,330 |
| 2016 | $4,413 | $63,540 | $13,100 | $50,440 |
| 2015 | $3,930 | $63,540 | $13,100 | $50,440 |
| 2014 | $3,940 | $63,540 | $13,100 | $50,440 |
| 2013 | $1,263 | $39,725 | $4,795 | $34,930 |
Source: Public Records
Map
Nearby Homes
- 46 W Russell St
- 46 Victorian Gate Way
- 26 Victorian Gate Way
- 674 Park St
- 37 Buttles Ave Unit D
- 769 N High St Unit 303
- 769 N High St Unit 304
- 89 E Lincoln St
- 845 N High St Unit 501 & 502
- 11 W 1st Ave Unit B
- 85-91 W 1st Ave
- 83 W 1st Ave
- 835 Summit St
- 69-71 E 1st Ave
- 109 Price Ave
- 915 Dennison Ave Unit 915
- 825 N 4th St Unit 402
- 312 Buttles Ave Unit 314
- 751 N 6th St Unit 410
- 884 Neil Ave
- 9 Victorian Gate Way
- 30 W Russell St
- 28 W Russell St
- 27 Victorian Gate Way
- 25 Victorian Gate Way
- 24 W Russell St
- 21 Victorian Gate Way
- 20 W Russell St
- 18 W Russell St
- 15 Victorian Gate Way
- 12 W Russell St
- 11 Victorian Gate Way Unit 11
- 9 Victorian Gate Way Unit 9
- 8 W Russell St
- 4 W Russell St
- 2 W Russell St
- 15 Victorian Gate Way Unit A
- 26 E Russell St
- 26 W Russell St
- 14 W Russell St