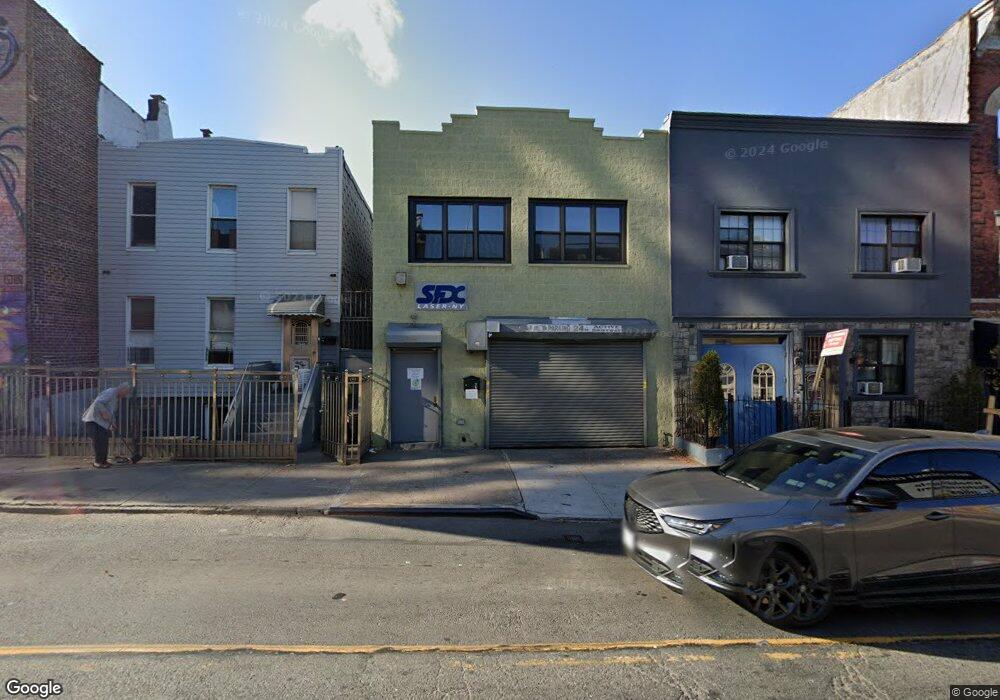
320 39th St Brooklyn, NY 11232
Sunset Park NeighborhoodEstimated Value: $1,716,429
Studio
--
Bath
2,350
Sq Ft
$730/Sq Ft
Est. Value
About This Home
This home is located at 320 39th St, Brooklyn, NY 11232 and is currently estimated at $1,716,429, approximately $730 per square foot. 320 39th St is a home located in Kings County with nearby schools including P.S. 24, Shema Kolainu-Hear Our Voices, and Our Lady Of Perpetual Help Catholic Academy.
Ownership History
Date
Name
Owned For
Owner Type
Purchase Details
Closed on
Aug 1, 2023
Sold by
Bk 39Th St Llc
Bought by
320 39 Street Llc
Current Estimated Value
Home Financials for this Owner
Home Financials are based on the most recent Mortgage that was taken out on this home.
Original Mortgage
$1,350,000
Outstanding Balance
$1,315,961
Interest Rate
6.71%
Mortgage Type
Purchase Money Mortgage
Estimated Equity
$400,468
Purchase Details
Closed on
May 4, 2016
Sold by
Veliu Holding Corp and Veliu-Osmani Holding Corp
Bought by
Bk 39Th St Llc
Purchase Details
Closed on
Jun 28, 2000
Sold by
Jairala Boris
Bought by
Veliu Osmani Holding Corp
Home Financials for this Owner
Home Financials are based on the most recent Mortgage that was taken out on this home.
Original Mortgage
$210,000
Interest Rate
8.1%
Mortgage Type
Commercial
Create a Home Valuation Report for This Property
The Home Valuation Report is an in-depth analysis detailing your home's value as well as a comparison with similar homes in the area
Home Values in the Area
Average Home Value in this Area
Purchase History
| Date | Buyer | Sale Price | Title Company |
|---|---|---|---|
| 320 39 Street Llc | $1,625,000 | -- | |
| 320 39 Street Llc | $1,625,000 | -- | |
| 320 39 Street Llc | $1,625,000 | -- | |
| Bk 39Th St Llc | $1,525,000 | -- | |
| Bk 39Th St Llc | $1,525,000 | -- | |
| Bk 39Th St Llc | $1,525,000 | -- | |
| Veliu Osmani Holding Corp | $260,000 | -- | |
| Veliu Osmani Holding Corp | $260,000 | -- |
Source: Public Records
Mortgage History
| Date | Status | Borrower | Loan Amount |
|---|---|---|---|
| Open | 320 39 Street Llc | $1,350,000 | |
| Closed | 320 39 Street Llc | $1,350,000 | |
| Previous Owner | Veliu Osmani Holding Corp | $210,000 |
Source: Public Records
Tax History
| Year | Tax Paid | Tax Assessment Tax Assessment Total Assessment is a certain percentage of the fair market value that is determined by local assessors to be the total taxable value of land and additions on the property. | Land | Improvement |
|---|---|---|---|---|
| 2025 | $24,366 | $269,100 | $33,300 | $235,800 |
| 2024 | $24,366 | $279,000 | $33,300 | $245,700 |
| 2023 | $22,286 | $237,600 | $33,300 | $204,300 |
| 2022 | $15,623 | $207,900 | $33,300 | $174,600 |
| 2021 | $19,230 | $195,300 | $33,300 | $162,000 |
| 2019 | $15,225 | $175,500 | $33,300 | $142,200 |
| 2018 | $14,156 | $159,300 | $33,300 | $126,000 |
| 2017 | $13,362 | $138,600 | $33,300 | $105,300 |
| 2016 | $12,972 | $130,050 | $27,450 | $102,600 |
| 2015 | $8,018 | $120,600 | $27,450 | $93,150 |
| 2014 | $8,018 | $124,650 | $27,450 | $97,200 |
Source: Public Records
Map
Nearby Homes
Your Personal Tour Guide
Ask me questions while you tour the home.