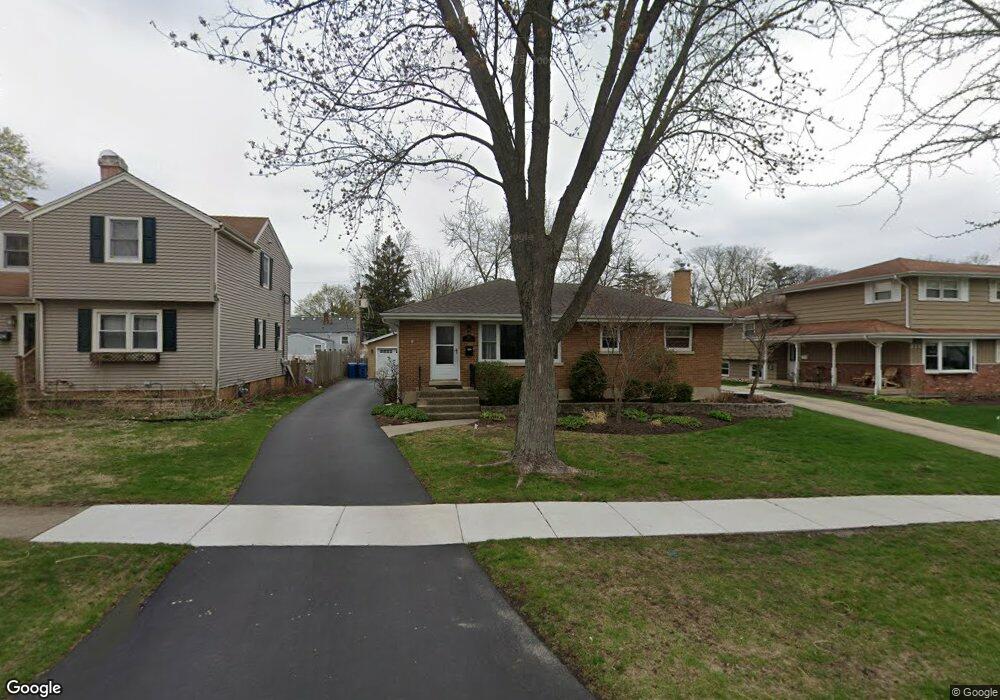
320 8th St Downers Grove, IL 60515
Estimated Value: $382,000 - $563,000
3
Beds
2
Baths
1,560
Sq Ft
$288/Sq Ft
Est. Value
About This Home
This home is located at 320 8th St, Downers Grove, IL 60515 and is currently estimated at $448,517, approximately $287 per square foot. 320 8th St is a home located in DuPage County with nearby schools including Whittier Elementary School, Herrick Middle School, and Downer Grove North High School.
Ownership History
Date
Name
Owned For
Owner Type
Purchase Details
Closed on
Jun 1, 2006
Sold by
Raymond Rachael F and Jensen Louis
Bought by
Gador Jeanne F and Barkley Patrick W
Current Estimated Value
Home Financials for this Owner
Home Financials are based on the most recent Mortgage that was taken out on this home.
Original Mortgage
$263,200
Outstanding Balance
$155,518
Interest Rate
6.66%
Mortgage Type
Fannie Mae Freddie Mac
Estimated Equity
$292,999
Purchase Details
Closed on
Aug 12, 2003
Sold by
Raymond Rachael F
Bought by
Raymond Rachael F and Jensen Louis
Purchase Details
Closed on
Apr 29, 2003
Sold by
Raymond William and Raymond Rachael
Bought by
Raymond Rachael
Home Financials for this Owner
Home Financials are based on the most recent Mortgage that was taken out on this home.
Original Mortgage
$224,010
Interest Rate
5.86%
Mortgage Type
Balloon
Create a Home Valuation Report for This Property
The Home Valuation Report is an in-depth analysis detailing your home's value as well as a comparison with similar homes in the area
Home Values in the Area
Average Home Value in this Area
Purchase History
| Date | Buyer | Sale Price | Title Company |
|---|---|---|---|
| Gador Jeanne F | $329,000 | First American Title | |
| Raymond Rachael F | -- | -- | |
| Raymond Rachael | -- | -- | |
| Raymond William A | $249,000 | Multiple |
Source: Public Records
Mortgage History
| Date | Status | Borrower | Loan Amount |
|---|---|---|---|
| Open | Gador Jeanne F | $263,200 | |
| Previous Owner | Raymond William A | $224,010 |
Source: Public Records
Tax History
| Year | Tax Paid | Tax Assessment Tax Assessment Total Assessment is a certain percentage of the fair market value that is determined by local assessors to be the total taxable value of land and additions on the property. | Land | Improvement |
|---|---|---|---|---|
| 2024 | $7,665 | $141,881 | $63,995 | $77,886 |
| 2023 | $7,049 | $130,430 | $58,830 | $71,600 |
| 2022 | $6,830 | $125,900 | $56,790 | $69,110 |
| 2021 | $6,391 | $124,460 | $56,140 | $68,320 |
| 2020 | $6,272 | $122,000 | $55,030 | $66,970 |
| 2019 | $6,248 | $116,630 | $52,800 | $63,830 |
| 2018 | $5,874 | $108,780 | $52,520 | $56,260 |
| 2017 | $5,685 | $104,680 | $50,540 | $54,140 |
| 2016 | $5,569 | $99,900 | $48,230 | $51,670 |
| 2015 | $5,503 | $93,990 | $45,380 | $48,610 |
| 2014 | $5,504 | $91,380 | $44,120 | $47,260 |
| 2013 | $5,391 | $90,950 | $43,910 | $47,040 |
Source: Public Records
Map
Nearby Homes
- 5333 Fairview Ave
- 215 7th St
- 319 5th St
- 128 55th St
- 226 White Fawn Trail
- 5632 Fairview Ave
- 5335 Blodgett Ave
- 228 4th St
- 112 6th St
- 5429 Benton Ave
- 5201 Cumnor Rd
- 5835 Doe Cir Unit 8
- 5120 Grand Ave
- 122 S Park St
- 140 S Hudson St
- 5504 Lyman Ave
- 342 Maple Ave
- 4946 Douglas Rd Unit 202
- 18 S Hudson St
- 301 Sheldon Ave
Your Personal Tour Guide
Ask me questions while you tour the home.