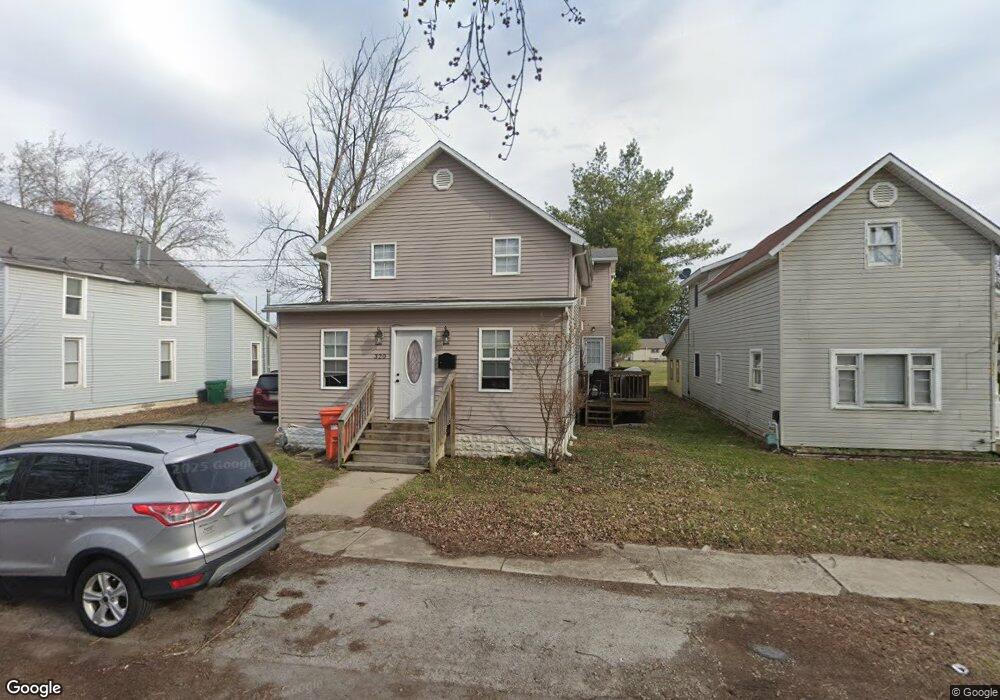
320 Allen Ave Findlay, OH 45840
Estimated Value: $143,000 - $148,000
3
Beds
3
Baths
1,768
Sq Ft
$82/Sq Ft
Est. Value
About This Home
This home is located at 320 Allen Ave, Findlay, OH 45840 and is currently estimated at $145,333, approximately $82 per square foot. 320 Allen Ave is a home located in Hancock County with nearby schools including Whittier Primary School, Bigelow Hill Elementary School, and Glenwood Middle School.
Ownership History
Date
Name
Owned For
Owner Type
Purchase Details
Closed on
Dec 13, 2016
Sold by
Schlachter Jesse
Bought by
Pro Tech Rental Properties Llc
Current Estimated Value
Purchase Details
Closed on
Dec 28, 2004
Sold by
Wells Fargo Bank Na
Bought by
Schlachter Jesse and Schlachter Jesse E
Home Financials for this Owner
Home Financials are based on the most recent Mortgage that was taken out on this home.
Original Mortgage
$38,800
Interest Rate
5.78%
Mortgage Type
Unknown
Purchase Details
Closed on
Mar 4, 2004
Sold by
Hill Heath R and Hill Jennifer D
Bought by
Wells Fargo Bank Na and Delta Funding Home Equity Loan Trust 199
Create a Home Valuation Report for This Property
The Home Valuation Report is an in-depth analysis detailing your home's value as well as a comparison with similar homes in the area
Home Values in the Area
Average Home Value in this Area
Purchase History
| Date | Buyer | Sale Price | Title Company |
|---|---|---|---|
| Pro Tech Rental Properties Llc | $42,000 | None Available | |
| Schlachter Jesse | $48,500 | Mid Am Title | |
| Wells Fargo Bank Na | -- | Blancham Valley Title |
Source: Public Records
Mortgage History
| Date | Status | Borrower | Loan Amount |
|---|---|---|---|
| Previous Owner | Schlachter Jesse | $38,800 |
Source: Public Records
Tax History Compared to Growth
Tax History
| Year | Tax Paid | Tax Assessment Tax Assessment Total Assessment is a certain percentage of the fair market value that is determined by local assessors to be the total taxable value of land and additions on the property. | Land | Improvement |
|---|---|---|---|---|
| 2024 | $1,285 | $35,250 | $4,780 | $30,470 |
| 2023 | $1,287 | $35,250 | $4,780 | $30,470 |
| 2022 | $1,283 | $35,250 | $4,780 | $30,470 |
| 2021 | $1,101 | $26,370 | $4,800 | $21,570 |
| 2020 | $1,101 | $26,370 | $4,800 | $21,570 |
| 2019 | $1,080 | $26,370 | $4,800 | $21,570 |
| 2018 | $968 | $21,680 | $4,360 | $17,320 |
| 2017 | $968 | $21,680 | $4,360 | $17,320 |
| 2016 | $965 | $21,680 | $4,360 | $17,320 |
| 2015 | $1,112 | $24,730 | $4,740 | $19,990 |
| 2014 | $1,112 | $24,730 | $4,740 | $19,990 |
| 2012 | $1,467 | $32,390 | $4,740 | $27,650 |
Source: Public Records
Map
Nearby Homes
- 334 E Foulke Ave
- 230 Midland Ave
- 420 Allen Ave
- 206 Midland Ave
- 115 George St
- 715 Christina Ct
- 1825 Pershing St
- 247 Crystal Ave
- 1820 N Main St
- 1010 Brenda Ct
- 1908 Gayle Ln
- 600 Charles Ave
- 207 Ash Ave
- 2100 Candlewick Dr
- 1062 Vincent St
- 716 Winfield Ave
- 1934 Geffs Ave
- 706 N Cory St
- 304 Rector Ave
- 0 Sheridan Ave