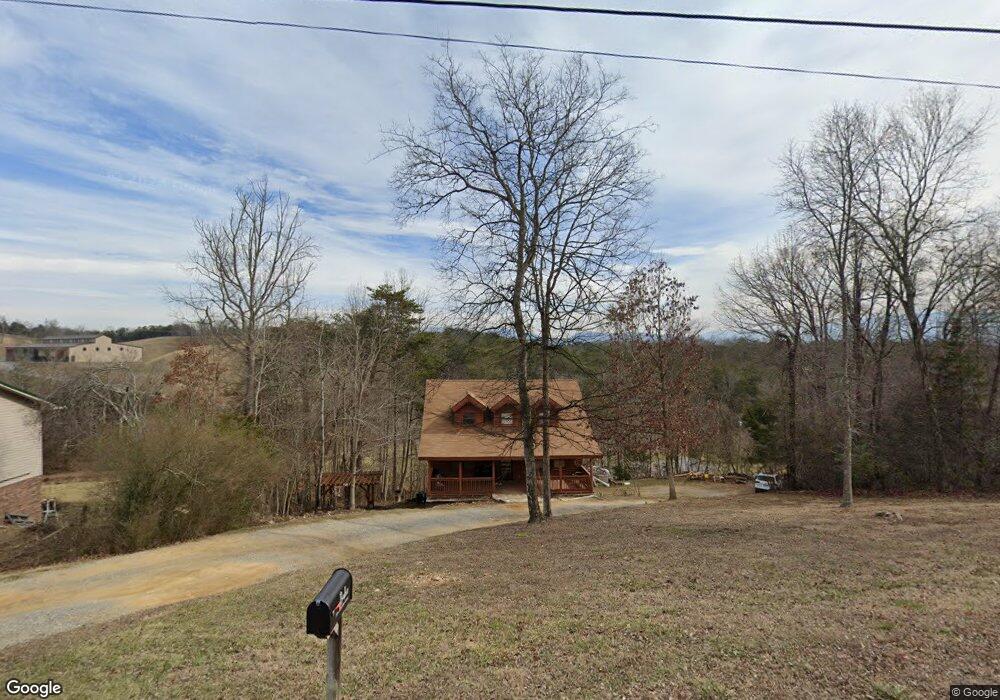
320 Amolee Ln Sevierville, TN 37876
Estimated Value: $429,854 - $456,000
3
Beds
3
Baths
2,186
Sq Ft
$203/Sq Ft
Est. Value
About This Home
This home is located at 320 Amolee Ln, Sevierville, TN 37876 and is currently estimated at $442,927, approximately $202 per square foot. 320 Amolee Ln is a home located in Sevier County with nearby schools including Catons Chapel Elementary School, Jones Cove Elementary School, and Northview Elementary School.
Ownership History
Date
Name
Owned For
Owner Type
Purchase Details
Closed on
Feb 13, 2018
Sold by
Davenport Emily
Bought by
Blue Ridge Home Solutions Llc
Current Estimated Value
Purchase Details
Closed on
Aug 31, 2010
Sold by
Blue Ridge Home Solutions
Bought by
Davenport Emily
Purchase Details
Closed on
Feb 2, 2010
Sold by
Morequity Inc
Bought by
Blue Ridge Home Solutions Llc
Purchase Details
Closed on
May 18, 2009
Sold by
Stalcup Joseph Drew
Bought by
Morequity Inc
Purchase Details
Closed on
Jun 30, 1995
Bought by
Drew Stalcup Joseph
Purchase Details
Closed on
May 25, 1994
Sold by
Kite Charles W Sub Tr
Bought by
Etal Stalcup Joseph Drew
Purchase Details
Closed on
May 24, 1994
Bought by
Stalcup Joseph Drew Rebecca
Purchase Details
Closed on
Nov 30, 1993
Sold by
Drew Stalcup Joseph
Bought by
Donald Klavinger
Purchase Details
Closed on
Dec 11, 1991
Bought by
Stalcup Joseph
Create a Home Valuation Report for This Property
The Home Valuation Report is an in-depth analysis detailing your home's value as well as a comparison with similar homes in the area
Home Values in the Area
Average Home Value in this Area
Purchase History
| Date | Buyer | Sale Price | Title Company |
|---|---|---|---|
| Blue Ridge Home Solutions Llc | -- | None Available | |
| Davenport Emily | -- | -- | |
| Blue Ridge Home Solutions Llc | $67,000 | -- | |
| Morequity Inc | $58,539 | -- | |
| Drew Stalcup Joseph | -- | -- | |
| Etal Stalcup Joseph Drew | -- | -- | |
| Stalcup Joseph Drew Rebecca | $122,900 | -- | |
| Donald Klavinger | $122,900 | -- | |
| Stalcup Joseph | $84,000 | -- |
Source: Public Records
Tax History Compared to Growth
Tax History
| Year | Tax Paid | Tax Assessment Tax Assessment Total Assessment is a certain percentage of the fair market value that is determined by local assessors to be the total taxable value of land and additions on the property. | Land | Improvement |
|---|---|---|---|---|
| 2025 | $625 | $42,250 | $6,200 | $36,050 |
| 2024 | $625 | $42,250 | $6,200 | $36,050 |
| 2023 | $625 | $42,250 | $0 | $0 |
| 2022 | $625 | $42,250 | $6,200 | $36,050 |
| 2021 | $625 | $42,250 | $6,200 | $36,050 |
| 2020 | $613 | $42,250 | $6,200 | $36,050 |
| 2019 | $613 | $32,950 | $6,275 | $26,675 |
| 2018 | $613 | $32,950 | $6,275 | $26,675 |
| 2017 | $613 | $32,950 | $6,275 | $26,675 |
| 2016 | $613 | $32,950 | $6,275 | $26,675 |
| 2015 | -- | $33,925 | $0 | $0 |
| 2014 | $553 | $33,937 | $0 | $0 |
Source: Public Records
Map
Nearby Homes
- 334 Amolee Ln
- 324 Oak Vista Ct
- 406 Oak Sky Way
- 410 Oak Sky Way
- PC 12.01 Newport Hwy
- 0 Oak Lake Dr Unit 1273077
- Lot 69 Oak Lake Dr
- Lot 55 Oak Lake Dr
- 440 Oak Sky Way
- 2031 Oakmont Dr
- 393 & 395 Lane Hollow Rd
- 393 Lane Hollow Rd
- Lot 15 Mount Buckley Ln
- 2054 Oakmont Dr
- Lot 17 Mount Buckley Ln
- Lot 1 Mount Buckley Ln
- Lot 3 Mount Buckley Ln
- Lot 10 Mount Buckley Ln
- 0 Newport Hwy Unit 1318772
- 2039 Oakmont Dr