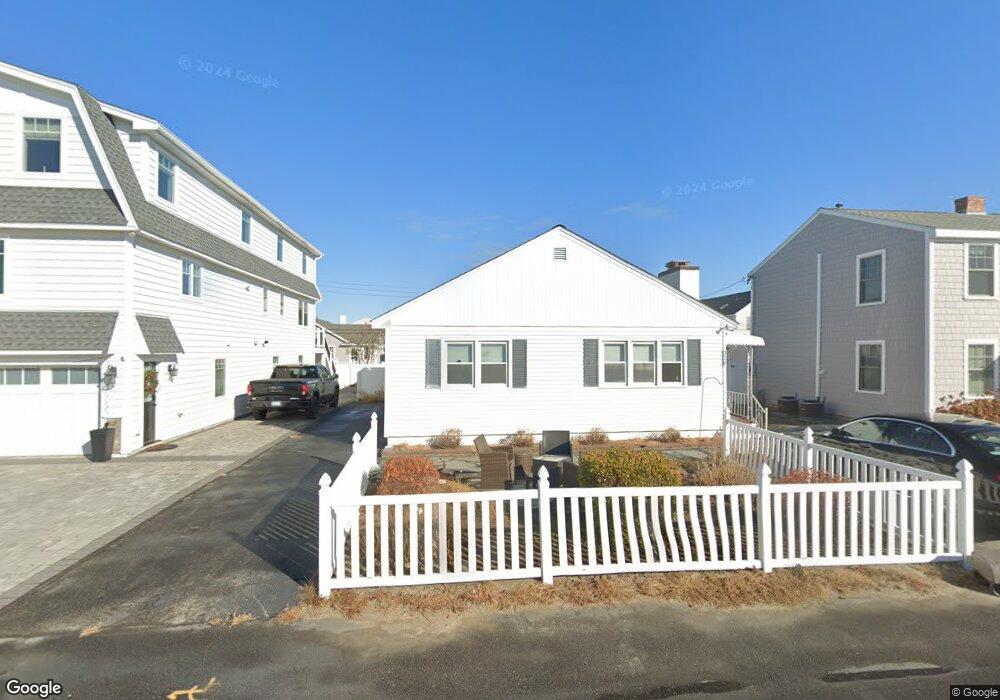
320 Ashland St Seabrook, NH 03874
Seabrook Beach NeighborhoodEstimated Value: $1,050,000 - $1,163,000
3
Beds
1
Bath
1,148
Sq Ft
$979/Sq Ft
Est. Value
About This Home
This home is located at 320 Ashland St, Seabrook, NH 03874 and is currently estimated at $1,124,220, approximately $979 per square foot. 320 Ashland St is a home located in Rockingham County with nearby schools including Seabrook Elementary School, Seabrook Middle School, and Winnacunnet High School.
Ownership History
Date
Name
Owned For
Owner Type
Purchase Details
Closed on
Oct 11, 2001
Sold by
Oconnor Thomas G and Oconnor Ruth A
Bought by
Kay Nicholas
Current Estimated Value
Home Financials for this Owner
Home Financials are based on the most recent Mortgage that was taken out on this home.
Original Mortgage
$264,000
Outstanding Balance
$103,641
Interest Rate
6.93%
Mortgage Type
Purchase Money Mortgage
Estimated Equity
$1,020,579
Create a Home Valuation Report for This Property
The Home Valuation Report is an in-depth analysis detailing your home's value as well as a comparison with similar homes in the area
Home Values in the Area
Average Home Value in this Area
Purchase History
| Date | Buyer | Sale Price | Title Company |
|---|---|---|---|
| Kay Nicholas | $330,000 | -- |
Source: Public Records
Mortgage History
| Date | Status | Borrower | Loan Amount |
|---|---|---|---|
| Open | Kay Nicholas | $264,000 |
Source: Public Records
Tax History Compared to Growth
Tax History
| Year | Tax Paid | Tax Assessment Tax Assessment Total Assessment is a certain percentage of the fair market value that is determined by local assessors to be the total taxable value of land and additions on the property. | Land | Improvement |
|---|---|---|---|---|
| 2024 | $10,713 | $914,100 | $721,900 | $192,200 |
| 2023 | $10,672 | $707,200 | $549,100 | $158,100 |
| 2022 | $9,370 | $707,200 | $549,100 | $158,100 |
| 2021 | $9,710 | $707,200 | $549,100 | $158,100 |
| 2020 | $8,653 | $541,800 | $426,200 | $115,600 |
| 2019 | $8,533 | $541,800 | $426,200 | $115,600 |
| 2018 | $8,804 | $541,800 | $426,200 | $115,600 |
| 2017 | $7,802 | $480,100 | $364,500 | $115,600 |
| 2016 | $6,558 | $443,400 | $330,900 | $112,500 |
| 2015 | $6,225 | $420,900 | $314,300 | $106,600 |
| 2014 | $6,113 | $400,300 | $293,700 | $106,600 |
| 2013 | $6,113 | $400,300 | $293,700 | $106,600 |
Source: Public Records
Map
Nearby Homes
- 108 Ocean Dr Unit 1
- 376 Ocean Blvd
- 9 Tyngsboro St
- 13-15 Ocean Blvd
- 13 Ocean Blvd
- 15 Ocean Blvd
- 27 Cross Beach Rd
- 3 Harris Ave
- 5 Fellows Ave
- 10 Haverhill Ave Unit 1
- 10 Haverhill Ave Unit 2
- 19 Riverview Terrace
- 17 Johnson Ave
- 3 Perkins Ave Unit 1
- 27 Perkins Ave
- 126 Ocean Blvd
- 22 1/2 I St Unit 2
- 27 Hobson Ave
- 19 F St
- 595 N End Blvd Unit 2
- 319 Ashland St
- 321 Ashland St
- 318 Ashland St
- 322 Ashland St
- 345 Woodstock St
- 344 Woodstock St
- 346 Woodstock St
- 248 Ashland St
- 343 Woodstock St
- 347 Woodstock St
- 247 Ashland St
- 249 Ashland St
- 317 Ashland St
- 323 Ashland St
- 250 Ashland St
- 246 Ashland St
- 342 Woodstock St
- 348 Woodstock St
- 245 Ashland St
- 316 Ashland St