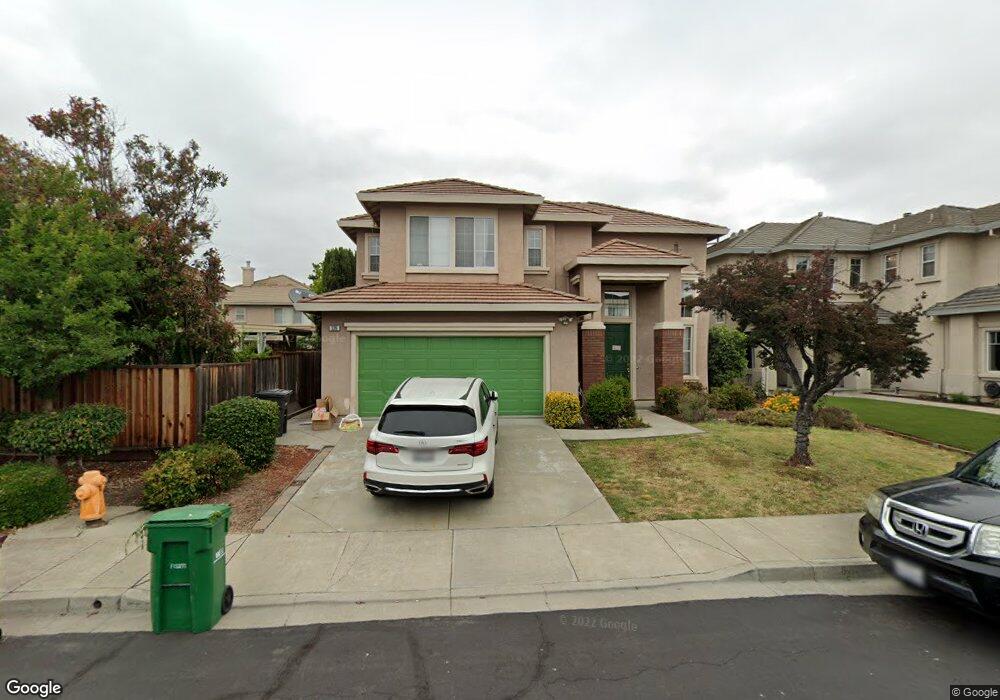
320 Bridgecreek Way Hayward, CA 94544
Fairway Park NeighborhoodEstimated Value: $1,508,878 - $1,561,000
4
Beds
3
Baths
2,286
Sq Ft
$670/Sq Ft
Est. Value
About This Home
This home is located at 320 Bridgecreek Way, Hayward, CA 94544 and is currently estimated at $1,531,470, approximately $669 per square foot. 320 Bridgecreek Way is a home located in Alameda County with nearby schools including Treeview Elementary, Cesar Chavez Middle School, and Tennyson High School.
Ownership History
Date
Name
Owned For
Owner Type
Purchase Details
Closed on
Apr 26, 2004
Sold by
Bobila Christian Roland
Bought by
Zhang Lin Lulang and Zhang Chen
Current Estimated Value
Home Financials for this Owner
Home Financials are based on the most recent Mortgage that was taken out on this home.
Original Mortgage
$494,400
Outstanding Balance
$205,012
Interest Rate
3.87%
Mortgage Type
Purchase Money Mortgage
Estimated Equity
$1,326,458
Purchase Details
Closed on
Sep 24, 2001
Sold by
Bukhsh Fahim and Bukhsh Samsun N
Bought by
Bobila Christian Roland
Home Financials for this Owner
Home Financials are based on the most recent Mortgage that was taken out on this home.
Original Mortgage
$432,000
Interest Rate
6.91%
Purchase Details
Closed on
Mar 10, 2000
Sold by
Bukhsh Fahim and Bukhsh Samsun N
Bought by
Bukhsh Fahim and Bukhsh Samsun N
Purchase Details
Closed on
Apr 22, 1999
Sold by
Standard Pacific Corp
Bought by
Bukhsh Fahim and Bukhsh Samsun N
Home Financials for this Owner
Home Financials are based on the most recent Mortgage that was taken out on this home.
Original Mortgage
$260,800
Interest Rate
7.1%
Create a Home Valuation Report for This Property
The Home Valuation Report is an in-depth analysis detailing your home's value as well as a comparison with similar homes in the area
Home Values in the Area
Average Home Value in this Area
Purchase History
| Date | Buyer | Sale Price | Title Company |
|---|---|---|---|
| Zhang Lin Lulang | $618,000 | Chicago Title Company | |
| Bobila Christian Roland | $540,000 | Commonwealth Land Title Co | |
| Bukhsh Fahim | -- | -- | |
| Bukhsh Fahim | $326,000 | First American Title Guarant |
Source: Public Records
Mortgage History
| Date | Status | Borrower | Loan Amount |
|---|---|---|---|
| Open | Zhang Lin Lulang | $494,400 | |
| Previous Owner | Bobila Christian Roland | $432,000 | |
| Previous Owner | Bukhsh Fahim | $260,800 | |
| Closed | Zhang Lin Lulang | $61,750 |
Source: Public Records
Tax History Compared to Growth
Tax History
| Year | Tax Paid | Tax Assessment Tax Assessment Total Assessment is a certain percentage of the fair market value that is determined by local assessors to be the total taxable value of land and additions on the property. | Land | Improvement |
|---|---|---|---|---|
| 2025 | $11,452 | $896,759 | $263,016 | $640,743 |
| 2024 | $11,452 | $879,042 | $257,860 | $628,182 |
| 2023 | $11,251 | $868,669 | $252,804 | $615,865 |
| 2022 | $11,031 | $844,639 | $247,848 | $603,791 |
| 2021 | $10,988 | $827,946 | $242,990 | $591,956 |
| 2020 | $10,873 | $826,390 | $240,500 | $585,890 |
| 2019 | $10,961 | $810,186 | $235,784 | $574,402 |
| 2018 | $10,277 | $794,301 | $231,161 | $563,140 |
| 2017 | $10,029 | $778,726 | $226,628 | $552,098 |
| 2016 | $9,498 | $763,458 | $222,185 | $541,273 |
| 2015 | $9,317 | $751,990 | $218,847 | $533,143 |
| 2014 | $8,522 | $700,000 | $210,000 | $490,000 |
Source: Public Records
Map
Nearby Homes
- 250 Bridgewater Rd
- 29710 Hansen St
- 260 Industrial Pkwy Unit 5
- 260 Industrial Pkwy Unit 47
- 29869 Vanderbilt St
- 30236 Vanderbilt St
- 235 Dash Ct
- 30487 Carroll Ave
- 649 Cherokee Ct
- 100 Boardwalk Way
- 30565 Prestwick Ave
- 409 Line St
- 389 Line St
- 29583 Vanderbilt St Unit 310
- 625 Delve Ct
- 30847 Prestwick Ave
- 675 Delve Ct
- 29361 Hub Ct
- 581 Fairway St
- 29322 Hub Ln
- 324 Bridgecreek Way
- 310 Bridgecreek Way
- 328 Bridgecreek Way
- 30083 Bridgeview Way
- 30089 Bridgeview Way
- 30095 Bridgeview Way
- 321 Bridgecreek Way
- 332 Bridgecreek Way
- 325 Bridgecreek Way
- 30071 Bridgeview Way
- 317 Bridgecreek Way
- 30101 Bridgeview Way
- 329 Bridgecreek Way
- 313 Bridgecreek Way
- 336 Bridgecreek Way
- 309 Bridgecreek Way
- 333 Bridgecreek Way
- 30107 Bridgeview Way
- 305 Bridgecreek Way
- 291 Bridgehead Ln