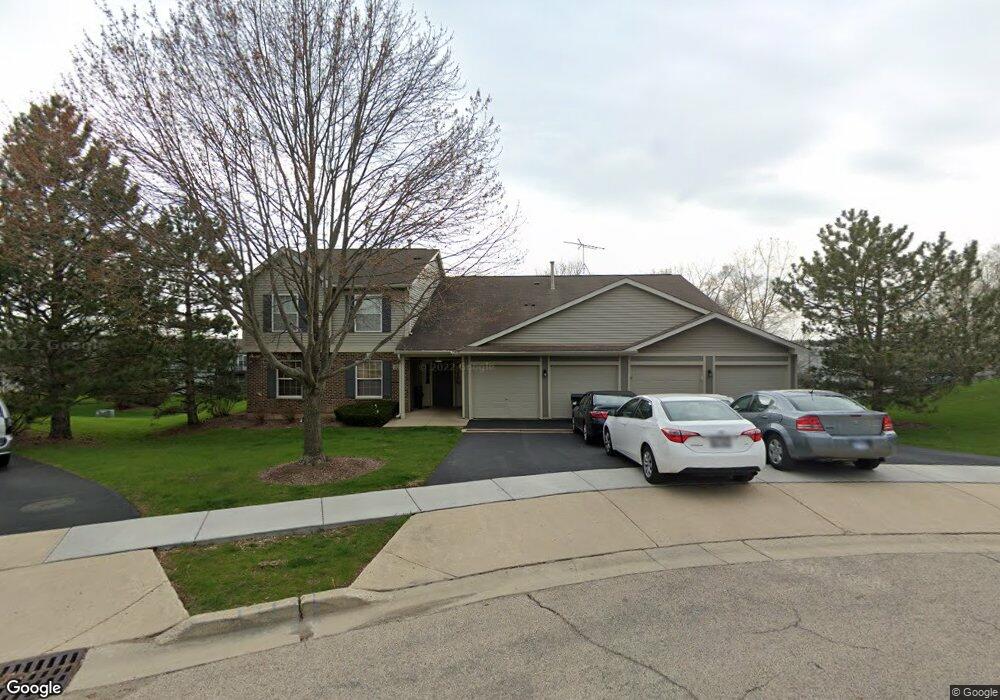
320 Buckingham Cir Unit 7A Elgin, IL 60120
Bluff City NeighborhoodEstimated Value: $195,840 - $231,000
2
Beds
--
Bath
1,175
Sq Ft
$188/Sq Ft
Est. Value
About This Home
This home is located at 320 Buckingham Cir Unit 7A, Elgin, IL 60120 and is currently estimated at $220,960, approximately $188 per square foot. 320 Buckingham Cir Unit 7A is a home located in Cook County with nearby schools including Hilltop Elementary School, Ellis Middle School, and Elgin High School.
Ownership History
Date
Name
Owned For
Owner Type
Purchase Details
Closed on
Jul 5, 2005
Sold by
Cosino Nancy M
Bought by
Baxter Lori
Current Estimated Value
Home Financials for this Owner
Home Financials are based on the most recent Mortgage that was taken out on this home.
Original Mortgage
$30,600
Outstanding Balance
$24,802
Interest Rate
7.62%
Mortgage Type
Credit Line Revolving
Estimated Equity
$196,158
Purchase Details
Closed on
Apr 26, 2002
Sold by
Khan Mustafa A
Bought by
Cosino Nancy M
Home Financials for this Owner
Home Financials are based on the most recent Mortgage that was taken out on this home.
Original Mortgage
$116,850
Interest Rate
7.07%
Purchase Details
Closed on
Oct 23, 1998
Sold by
First Midwest Trust Company Natl Assn
Bought by
Khan Mustafa A
Home Financials for this Owner
Home Financials are based on the most recent Mortgage that was taken out on this home.
Original Mortgage
$90,500
Interest Rate
6.37%
Create a Home Valuation Report for This Property
The Home Valuation Report is an in-depth analysis detailing your home's value as well as a comparison with similar homes in the area
Home Values in the Area
Average Home Value in this Area
Purchase History
| Date | Buyer | Sale Price | Title Company |
|---|---|---|---|
| Baxter Lori | $153,000 | Pntn | |
| Cosino Nancy M | $123,000 | Ticor Title Insurance | |
| Khan Mustafa A | $95,500 | Ticor Title Insurance |
Source: Public Records
Mortgage History
| Date | Status | Borrower | Loan Amount |
|---|---|---|---|
| Open | Baxter Lori | $30,600 | |
| Previous Owner | Cosino Nancy M | $116,850 | |
| Previous Owner | Khan Mustafa A | $90,500 |
Source: Public Records
Tax History
| Year | Tax Paid | Tax Assessment Tax Assessment Total Assessment is a certain percentage of the fair market value that is determined by local assessors to be the total taxable value of land and additions on the property. | Land | Improvement |
|---|---|---|---|---|
| 2025 | $3,288 | $20,578 | $2,285 | $18,293 |
| 2024 | $3,288 | $14,738 | $2,121 | $12,617 |
| 2023 | $3,166 | $14,738 | $2,121 | $12,617 |
| 2022 | $3,166 | $14,738 | $2,121 | $12,617 |
| 2021 | $2,330 | $10,093 | $1,713 | $8,380 |
| 2020 | $2,394 | $10,093 | $1,713 | $8,380 |
| 2019 | $2,423 | $11,335 | $1,713 | $9,622 |
| 2018 | $1,593 | $8,125 | $1,468 | $6,657 |
| 2017 | $1,609 | $8,125 | $1,468 | $6,657 |
| 2016 | $1,793 | $8,125 | $1,468 | $6,657 |
| 2015 | $1,646 | $7,307 | $1,305 | $6,002 |
| 2014 | $1,612 | $7,307 | $1,305 | $6,002 |
| 2013 | $1,539 | $7,307 | $1,305 | $6,002 |
Source: Public Records
Map
Nearby Homes
- 330 Buckingham Cir Unit C
- 385 Woodview Cir Unit B
- 445 Lucile Ave
- 149 Highbury Dr
- 130 Stonehurst Dr
- 1182 Concord Dr
- 833 Forest Ave
- 513 Cookane Ave
- 1160 Case Ln
- 689 Bent St
- 335 Shiloh Ln
- 1154 Pegwood Dr
- 631 Bent St
- 899 Carl Ave
- 457 Arlington Ave
- 450 Villa St
- 1440 Eliot Trail
- 1089 Quaker Hill Ct Unit 711
- 483 Barrett St
- 115 N Porter St
- 320 Buckingham Cir Unit D
- 320 Buckingham Cir Unit 7A
- 320 Buckingham Cir Unit 7A
- 320 Buckingham Cir Unit 7A
- 320 Buckingham Cir Unit C
- 320 Buckingham Cir Unit B
- 330 Buckingham Cir Unit 6A
- 330 Buckingham Cir Unit 6A
- 330 Buckingham Cir Unit 6A
- 330 Buckingham Cir Unit 6A
- 330 Buckingham Cir Unit A
- 330 Buckingham Cir Unit D
- 330 Buckingham Cir Unit B
- 310 Buckingham Cir Unit 8A
- 310 Buckingham Cir Unit 8A
- 310 Buckingham Cir Unit 8A
- 310 Buckingham Cir Unit 8A
- 310 Buckingham Cir Unit A
- 310 Buckingham Cir Unit D
- 310 Buckingham Cir Unit C
Your Personal Tour Guide
Ask me questions while you tour the home.