Estimated Value: $102,586 - $197,000
2
Beds
2
Baths
1,232
Sq Ft
$122/Sq Ft
Est. Value
About This Home
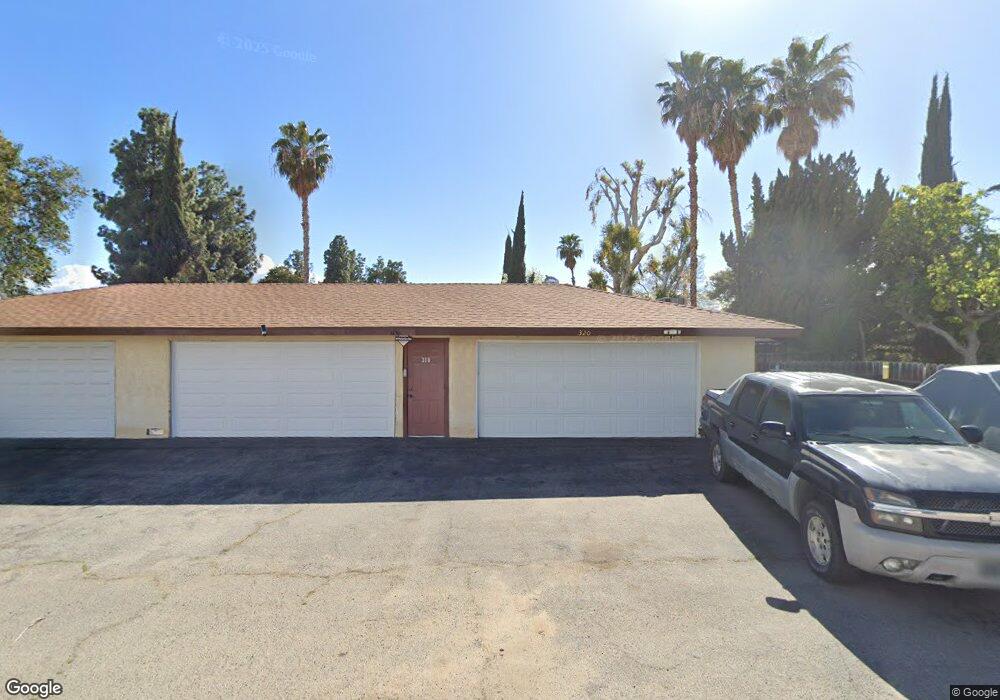
This home is located at 320 Calvin St, Taft, CA 93268 and is currently estimated at $149,793, approximately $121 per square foot. 320 Calvin St is a home located in Kern County with nearby schools including Taft Primary School, Roosevelt Elementary School, and Lincoln Junior High School.
Ownership History
Date
Name
Owned For
Owner Type
Purchase Details
Closed on
Feb 21, 2018
Sold by
Jacobs Laura
Bought by
Jacobs Laura
Current Estimated Value
Home Financials for this Owner
Home Financials are based on the most recent Mortgage that was taken out on this home.
Original Mortgage
$63,000
Outstanding Balance
$53,422
Interest Rate
4.04%
Mortgage Type
New Conventional
Estimated Equity
$96,371
Purchase Details
Closed on
Apr 2, 2010
Sold by
Jacobs Laura and The Kasper Family Trust
Bought by
Jacobs Laura
Purchase Details
Closed on
Sep 28, 2009
Sold by
Kasper Georgia M and Kasper Family Trust
Bought by
Kasper Georgia M and Kasper Family Trust
Create a Home Valuation Report for This Property
The Home Valuation Report is an in-depth analysis detailing your home's value as well as a comparison with similar homes in the area
Home Values in the Area
Average Home Value in this Area
Purchase History
| Date | Buyer | Sale Price | Title Company |
|---|---|---|---|
| Jacobs Laura | $63,000 | Fidelity National Title | |
| Jacobs Laura | -- | Accommodation | |
| Kasper Georgia M | -- | None Available |
Source: Public Records
Mortgage History
| Date | Status | Borrower | Loan Amount |
|---|---|---|---|
| Open | Jacobs Laura | $63,000 |
Source: Public Records
Tax History
| Year | Tax Paid | Tax Assessment Tax Assessment Total Assessment is a certain percentage of the fair market value that is determined by local assessors to be the total taxable value of land and additions on the property. | Land | Improvement |
|---|---|---|---|---|
| 2025 | $1,824 | $143,265 | $12,901 | $130,364 |
| 2024 | $1,744 | $140,457 | $12,649 | $127,808 |
| 2023 | $1,744 | $137,703 | $12,401 | $125,302 |
| 2022 | $1,716 | $135,004 | $12,158 | $122,846 |
| 2021 | $1,705 | $132,358 | $11,920 | $120,438 |
| 2020 | $1,603 | $131,002 | $11,798 | $119,204 |
| 2019 | $1,576 | $131,002 | $11,798 | $119,204 |
| 2018 | $1,538 | $125,917 | $11,341 | $114,576 |
| 2017 | $1,464 | $123,449 | $11,119 | $112,330 |
| 2016 | $1,556 | $121,029 | $10,901 | $110,128 |
| 2015 | $1,420 | $119,212 | $10,738 | $108,474 |
| 2014 | $1,350 | $116,878 | $10,528 | $106,350 |
Source: Public Records
Map
Nearby Homes
Your Personal Tour Guide
Ask me questions while you tour the home.