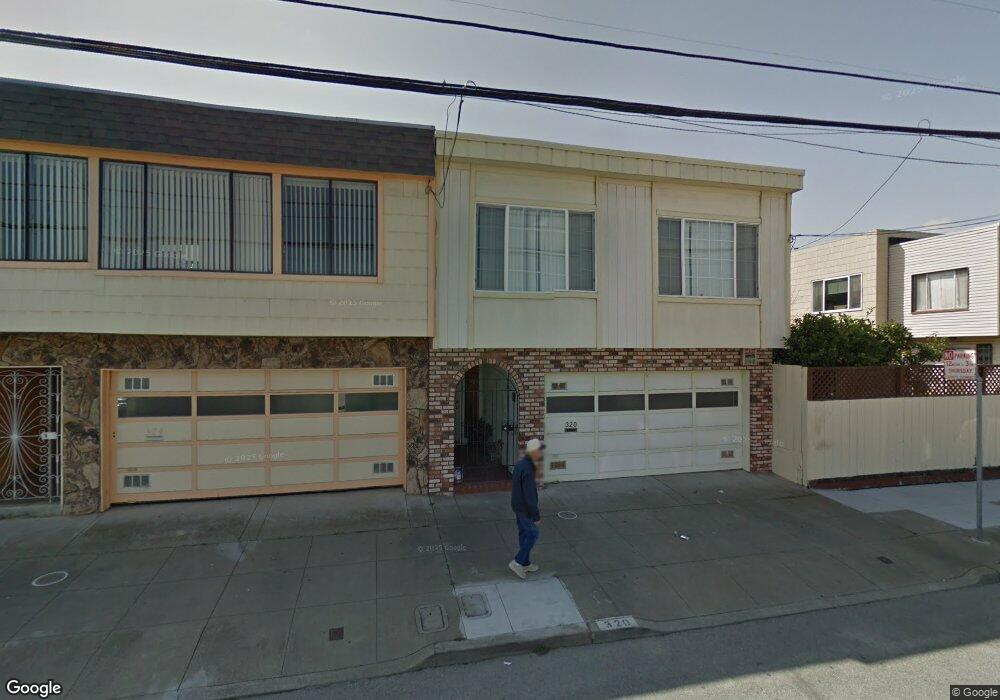
320 Cambridge St San Francisco, CA 94134
Portola NeighborhoodEstimated Value: $1,141,000 - $1,487,000
3
Beds
2
Baths
1,500
Sq Ft
$856/Sq Ft
Est. Value
About This Home
This home is located at 320 Cambridge St, San Francisco, CA 94134 and is currently estimated at $1,283,803, approximately $855 per square foot. 320 Cambridge St is a home located in San Francisco County with nearby schools including Hillcrest Elementary School, King Jr. (Martin Luther) Academic Middle School, and Golden Bridges School.
Ownership History
Date
Name
Owned For
Owner Type
Purchase Details
Closed on
Nov 30, 2021
Sold by
Lam Julia
Bought by
Lam Julia A and Lam Van Dang
Current Estimated Value
Purchase Details
Closed on
Mar 26, 2017
Sold by
Vandang Lu and Lam Julia
Bought by
Lam Julia
Purchase Details
Closed on
Aug 23, 1998
Sold by
Luong Daniel M and Luong Shirley Lam
Bought by
Lam Julia and Dang Lu Van
Purchase Details
Closed on
Oct 25, 1994
Sold by
Luong Daniel Minh and Lam Shirley
Bought by
Luong Daniel Minh and Lam Shirley
Home Financials for this Owner
Home Financials are based on the most recent Mortgage that was taken out on this home.
Original Mortgage
$212,000
Interest Rate
8.37%
Purchase Details
Closed on
Sep 7, 1994
Sold by
Chan Billy
Bought by
Luong Daniel Minh and Lam Shirley
Home Financials for this Owner
Home Financials are based on the most recent Mortgage that was taken out on this home.
Original Mortgage
$212,000
Interest Rate
8.37%
Create a Home Valuation Report for This Property
The Home Valuation Report is an in-depth analysis detailing your home's value as well as a comparison with similar homes in the area
Home Values in the Area
Average Home Value in this Area
Purchase History
| Date | Buyer | Sale Price | Title Company |
|---|---|---|---|
| Lam Julia A | -- | None Available | |
| Lam Julia | -- | None Available | |
| Lam Julia | $265,000 | -- | |
| Luong Daniel Minh | -- | -- | |
| Luong Daniel Minh | $265,000 | Chicago Title Company |
Source: Public Records
Mortgage History
| Date | Status | Borrower | Loan Amount |
|---|---|---|---|
| Previous Owner | Luong Daniel Minh | $212,000 |
Source: Public Records
Tax History Compared to Growth
Tax History
| Year | Tax Paid | Tax Assessment Tax Assessment Total Assessment is a certain percentage of the fair market value that is determined by local assessors to be the total taxable value of land and additions on the property. | Land | Improvement |
|---|---|---|---|---|
| 2025 | $5,901 | $445,092 | $167,955 | $277,137 |
| 2024 | $5,901 | $436,365 | $164,662 | $271,703 |
| 2023 | $5,804 | $427,810 | $161,434 | $266,376 |
| 2022 | $5,681 | $419,422 | $158,269 | $261,153 |
| 2021 | $5,576 | $411,199 | $155,166 | $256,033 |
| 2020 | $5,668 | $406,983 | $153,575 | $253,408 |
| 2019 | $5,479 | $399,004 | $150,564 | $248,440 |
| 2018 | $5,293 | $391,181 | $147,612 | $243,569 |
| 2017 | $4,933 | $383,512 | $144,718 | $238,794 |
| 2016 | $4,826 | $375,993 | $141,881 | $234,112 |
| 2015 | $4,762 | $370,346 | $139,750 | $230,596 |
| 2014 | $4,638 | $363,092 | $137,013 | $226,079 |
Source: Public Records
Map
Nearby Homes
- 324 Cambridge St
- 328 Cambridge St
- 1415 Silliman St
- 1407 Silliman St
- 1421 Silliman St
- 336 Cambridge St
- 1401 Silliman St
- 1427 Silliman St
- 1433 Silliman St
- 342 Cambridge St
- 225 Oxford St
- 231 Oxford St Unit studi
- 231 Oxford St
- 348 Cambridge St
- 237 Oxford St
- 219 Oxford St
- 243 Oxford St
- 215 Oxford St
- 354 Cambridge St
- 301 Cambridge St