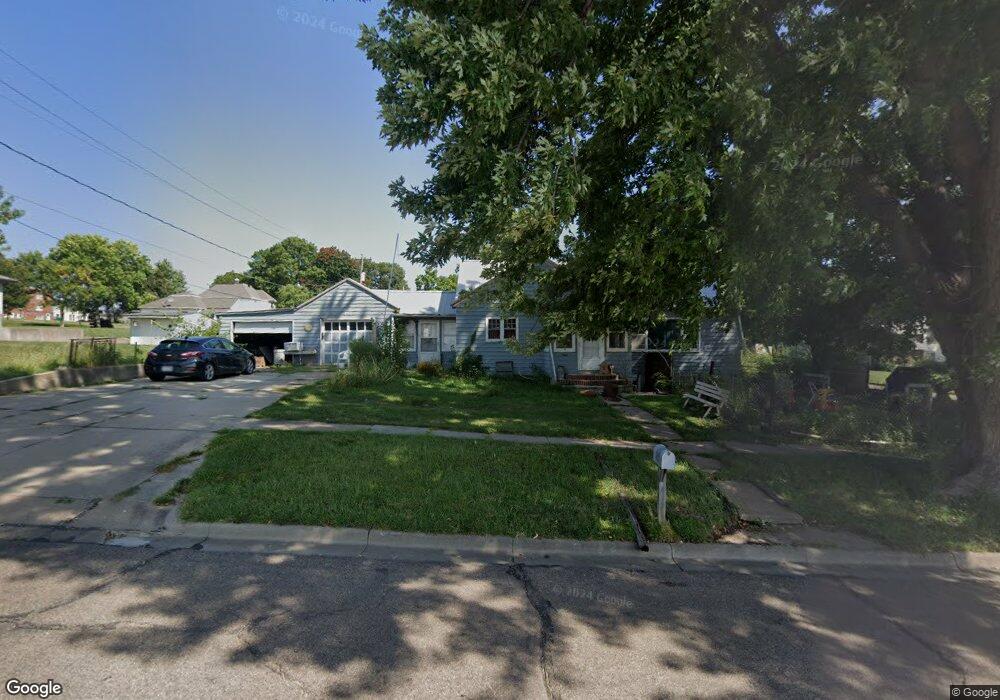
320 E 16th St Falls City, NE 68355
Estimated Value: $68,000 - $121,000
3
Beds
2
Baths
1,224
Sq Ft
$73/Sq Ft
Est. Value
About This Home
This home is located at 320 E 16th St, Falls City, NE 68355 and is currently estimated at $89,347, approximately $72 per square foot. 320 E 16th St is a home located in Richardson County with nearby schools including Falls City North Elementary School, Falls City South Elementary School, and Falls City Middle School.
Ownership History
Date
Name
Owned For
Owner Type
Purchase Details
Closed on
Nov 10, 2015
Sold by
Chandler Patrice M
Bought by
Maxwell Joshua W and Maxwell Samantha J
Current Estimated Value
Purchase Details
Closed on
Jan 19, 2010
Sold by
Peck Trust Marlin G
Bought by
Chandler Patrice M
Purchase Details
Closed on
Sep 13, 2004
Sold by
Peck Life Est Leta B
Bought by
Peck Trust Marlin G
Purchase Details
Closed on
Dec 19, 2002
Sold by
Peck Marlin G and Peck Lois E
Bought by
Peck Trust Marlin G
Create a Home Valuation Report for This Property
The Home Valuation Report is an in-depth analysis detailing your home's value as well as a comparison with similar homes in the area
Home Values in the Area
Average Home Value in this Area
Purchase History
| Date | Buyer | Sale Price | Title Company |
|---|---|---|---|
| Maxwell Joshua W | $28,000 | -- | |
| Chandler Patrice M | -- | -- | |
| Peck Trust Marlin G | $14,000 | -- | |
| Peck Trust Marlin G | -- | -- |
Source: Public Records
Tax History
| Year | Tax Paid | Tax Assessment Tax Assessment Total Assessment is a certain percentage of the fair market value that is determined by local assessors to be the total taxable value of land and additions on the property. | Land | Improvement |
|---|---|---|---|---|
| 2025 | $749 | $60,865 | $5,400 | $55,465 |
| 2024 | $502 | $57,725 | $5,400 | $52,325 |
| 2023 | $502 | $30,616 | $5,400 | $25,216 |
| 2022 | $529 | $27,570 | $3,240 | $24,330 |
| 2021 | $581 | $30,999 | $3,240 | $27,759 |
| 2020 | $562 | $29,677 | $3,240 | $26,437 |
| 2019 | $556 | $28,907 | $3,240 | $25,667 |
| 2018 | $547 | $28,159 | $3,240 | $24,919 |
| 2017 | $548 | $28,159 | $3,240 | $24,919 |
| 2016 | $531 | $27,433 | $3,240 | $24,193 |
| 2015 | $533 | $27,433 | $3,240 | $24,193 |
| 2014 | $532 | $27,433 | $3,240 | $24,193 |
Source: Public Records
Map
Nearby Homes