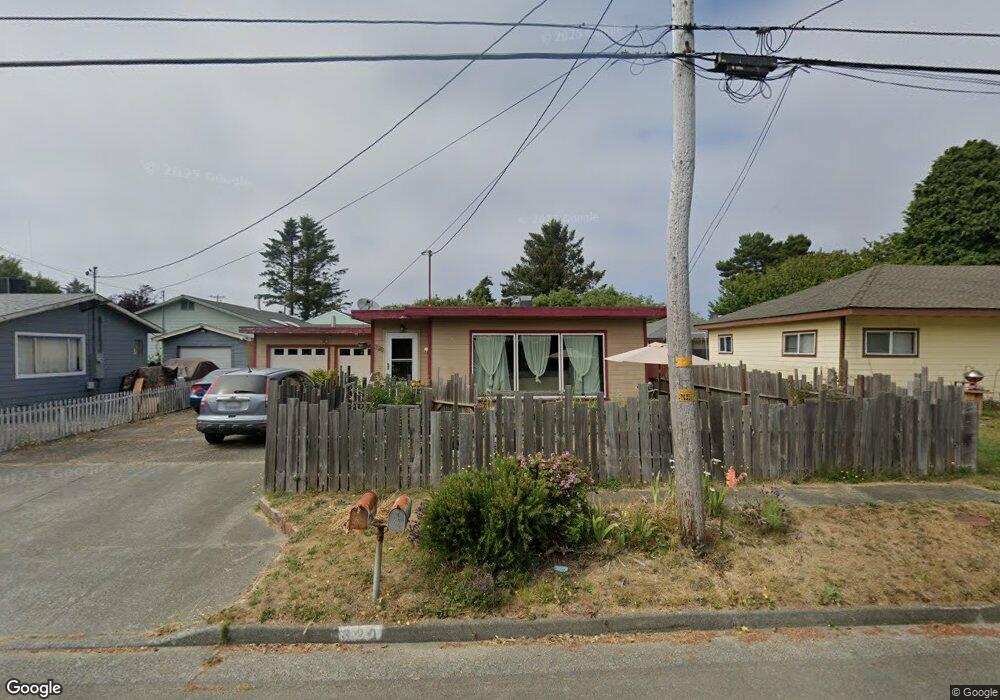
320 E Coolidge Ave Unit behind coast auto Crescent City, CA 95531
Estimated Value: $218,000 - $256,000
2
Beds
1
Bath
1,034
Sq Ft
$236/Sq Ft
Est. Value
About This Home
This home is located at 320 E Coolidge Ave Unit behind coast auto, Crescent City, CA 95531 and is currently estimated at $244,412, approximately $236 per square foot. 320 E Coolidge Ave Unit behind coast auto is a home located in Del Norte County with nearby schools including Bess Maxwell Elementary School, Crescent Elk Middle School, and Del Norte High School.
Ownership History
Date
Name
Owned For
Owner Type
Purchase Details
Closed on
Dec 16, 2015
Sold by
Jpmorgan Chase Bank Na
Bought by
Pearcey Molly
Current Estimated Value
Home Financials for this Owner
Home Financials are based on the most recent Mortgage that was taken out on this home.
Original Mortgage
$95,012
Outstanding Balance
$75,038
Interest Rate
3.83%
Mortgage Type
New Conventional
Estimated Equity
$169,374
Purchase Details
Closed on
Sep 29, 2015
Sold by
Barrett Kali M
Bought by
Jpmorgan Chase Bank Na
Purchase Details
Closed on
May 21, 2009
Sold by
Brown William George
Bought by
Barrett Kali M
Home Financials for this Owner
Home Financials are based on the most recent Mortgage that was taken out on this home.
Original Mortgage
$132,653
Interest Rate
4.82%
Mortgage Type
Unknown
Purchase Details
Closed on
Nov 7, 2006
Sold by
Brown William
Bought by
Brown William
Create a Home Valuation Report for This Property
The Home Valuation Report is an in-depth analysis detailing your home's value as well as a comparison with similar homes in the area
Home Values in the Area
Average Home Value in this Area
Purchase History
| Date | Buyer | Sale Price | Title Company |
|---|---|---|---|
| Pearcey Molly | $92,500 | Fatco | |
| Jpmorgan Chase Bank Na | $88,000 | Lawyers Title Company | |
| Barrett Kali M | $130,000 | Crescent Land Title Company | |
| Brown William | -- | None Available |
Source: Public Records
Mortgage History
| Date | Status | Borrower | Loan Amount |
|---|---|---|---|
| Open | Pearcey Molly | $95,012 | |
| Previous Owner | Barrett Kali M | $132,653 |
Source: Public Records
Tax History Compared to Growth
Tax History
| Year | Tax Paid | Tax Assessment Tax Assessment Total Assessment is a certain percentage of the fair market value that is determined by local assessors to be the total taxable value of land and additions on the property. | Land | Improvement |
|---|---|---|---|---|
| 2025 | $1,049 | $109,494 | $53,268 | $56,226 |
| 2024 | $1,049 | $107,348 | $52,224 | $55,124 |
| 2023 | $1,025 | $105,244 | $51,200 | $54,044 |
| 2022 | $1,002 | $103,182 | $50,197 | $52,985 |
| 2021 | $994 | $101,160 | $49,213 | $51,947 |
| 2020 | $987 | $100,124 | $48,709 | $51,415 |
| 2019 | $969 | $98,161 | $47,754 | $50,407 |
| 2018 | $948 | $96,237 | $46,818 | $49,419 |
| 2017 | $1,013 | $94,350 | $45,900 | $48,450 |
| 2016 | $947 | $86,983 | $46,598 | $40,385 |
| 2015 | $993 | $85,678 | $45,899 | $39,779 |
| 2014 | $978 | $85,385 | $45,204 | $40,181 |
Source: Public Records
Map
Nearby Homes
- 145 Mason Ct
- 120 W Coolidge Ave
- 373 Grant Ave
- 1210 Douglas St
- 125 W Washington Blvd
- 650 E Washington Blvd
- 650 E Washington Blvd Unit Crescent Senior Mobi
- 1102 Burtschell St
- 1329 Burtschell Place
- 0000 E Washington Blvd
- 0 E Adams Ave
- 227 Ruchong Ln
- 160 Leif Cir
- 525 Leif Cir
- 724 Butte St
- 1718 Northcrest Dr
- 1661 Northcrest Dr Unit Space 96
- 545 Reddy Ave
- 435 Leif Cir Unit Washington
- 120 Tide St
- 320 E Coolidge Ave
- 300 E Coolidge Ave
- 1321 Oregon St
- 1336 Oregon St
- 1290 Oregon St
- 1340 Northcrest Dr
- 1355 Oregon St
- 220 E Coolidge Ave
- 1356 Oregon St
- 1280 Marshall St
- 1280 Oregon St
- 1371 Oregon St
- 1327 California St
- 1270 Oregon St
- 1362 Oregon St
- 200 E Coolidge Ave
- 205 E Coolidge Ave
- 1260 Oregon St
- 1285 California St
- 1368 Oregon St