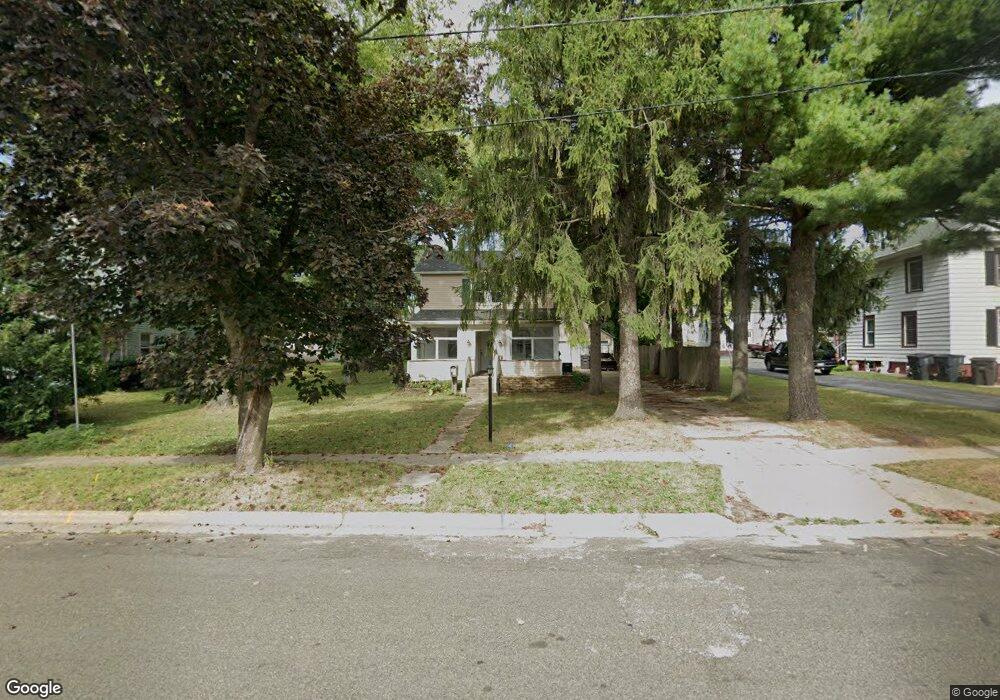
320 E Cravath St Whitewater, WI 53190
Estimated Value: $218,000 - $263,261
4
Beds
2
Baths
1,592
Sq Ft
$153/Sq Ft
Est. Value
About This Home
This home is located at 320 E Cravath St, Whitewater, WI 53190 and is currently estimated at $243,315, approximately $152 per square foot. 320 E Cravath St is a home located in Walworth County with nearby schools including Whitewater High School, Jedi Virtual K-12, and Kettle Moraine Baptist Academy.
Ownership History
Date
Name
Owned For
Owner Type
Purchase Details
Closed on
Jul 2, 2024
Sold by
Walworth County Sheriff
Bought by
Pennymac Loan Services Llc
Current Estimated Value
Purchase Details
Closed on
Nov 28, 2016
Sold by
Strong Kent S and Strong Rebecca L
Bought by
Kraayvanger Jonathan J and Kraayvanger Dana L
Home Financials for this Owner
Home Financials are based on the most recent Mortgage that was taken out on this home.
Original Mortgage
$134,343
Interest Rate
3.47%
Mortgage Type
New Conventional
Purchase Details
Closed on
Mar 24, 2011
Sold by
Fannie Mae
Bought by
Strong Kent S and Strong Rebecca L
Purchase Details
Closed on
Aug 12, 2010
Sold by
Bowey Amelia T
Bought by
Citimortgage Inc
Create a Home Valuation Report for This Property
The Home Valuation Report is an in-depth analysis detailing your home's value as well as a comparison with similar homes in the area
Home Values in the Area
Average Home Value in this Area
Purchase History
| Date | Buyer | Sale Price | Title Company |
|---|---|---|---|
| Pennymac Loan Services Llc | $140,000 | None Listed On Document | |
| Kraayvanger Jonathan J | $133,000 | None Available | |
| Strong Kent S | -- | None Available | |
| Citimortgage Inc | -- | None Available |
Source: Public Records
Mortgage History
| Date | Status | Borrower | Loan Amount |
|---|---|---|---|
| Previous Owner | Kraayvanger Jonathan J | $134,343 |
Source: Public Records
Tax History
| Year | Tax Paid | Tax Assessment Tax Assessment Total Assessment is a certain percentage of the fair market value that is determined by local assessors to be the total taxable value of land and additions on the property. | Land | Improvement |
|---|---|---|---|---|
| 2025 | $3,713 | $228,500 | $58,400 | $170,100 |
| 2024 | $3,106 | $208,000 | $58,400 | $149,600 |
| 2023 | $3,076 | $192,100 | $58,400 | $133,700 |
| 2022 | $2,923 | $172,300 | $58,400 | $113,900 |
| 2021 | $2,896 | $158,500 | $58,400 | $100,100 |
| 2020 | $2,950 | $145,900 | $58,400 | $87,500 |
| 2019 | $2,928 | $143,300 | $58,400 | $84,900 |
| 2018 | $2,887 | $140,500 | $58,400 | $82,100 |
| 2017 | $2,625 | $133,200 | $58,400 | $74,800 |
| 2016 | $2,624 | $128,500 | $58,400 | $70,100 |
| 2015 | $2,573 | $126,200 | $58,400 | $67,800 |
| 2014 | $2,514 | $124,700 | $58,400 | $66,300 |
| 2013 | $2,514 | $120,900 | $58,400 | $62,500 |
Source: Public Records
Map
Nearby Homes
- 146 W Main St
- 234 N George St
- 112 S 1st St
- 650 E North St
- 175 N Park St
- Lt10B E Main St
- 119 S 4th St
- 637 E Clay St
- 406 W Center St
- 129 S Church St
- 803 E Milwaukee St
- 848 E Commercial Ave
- Lt13 Tripp Lake Estates
- Lt5B Endeavor Dr
- 805 W Highland St
- 824 W Conger St
- Lt9B Enterprise Blvd
- 630 S Wisconsin St
- Lt9 Pearson Ct
- Lt7 Pearson Ct
- 312 E Cravath St
- 328 E Cravath St
- 306 E Cravath St
- 334 E Cravath St
- 317 N Cherry St
- 331 E Harriet St
- 338 E Cravath St
- 323 N Cherry St
- 322 N Wakely St
- 319 E Cravath St
- 325 E Cravath St
- 311 E Cravath St
- 337 E Cravath St
- 236 E Cravath St
- 329 E Cravath St
- 303 E Cravath St
- 324 N Cherry St
- 404 E Cravath St
- 335 N Cherry St
- 224 N Wakely St
Your Personal Tour Guide
Ask me questions while you tour the home.