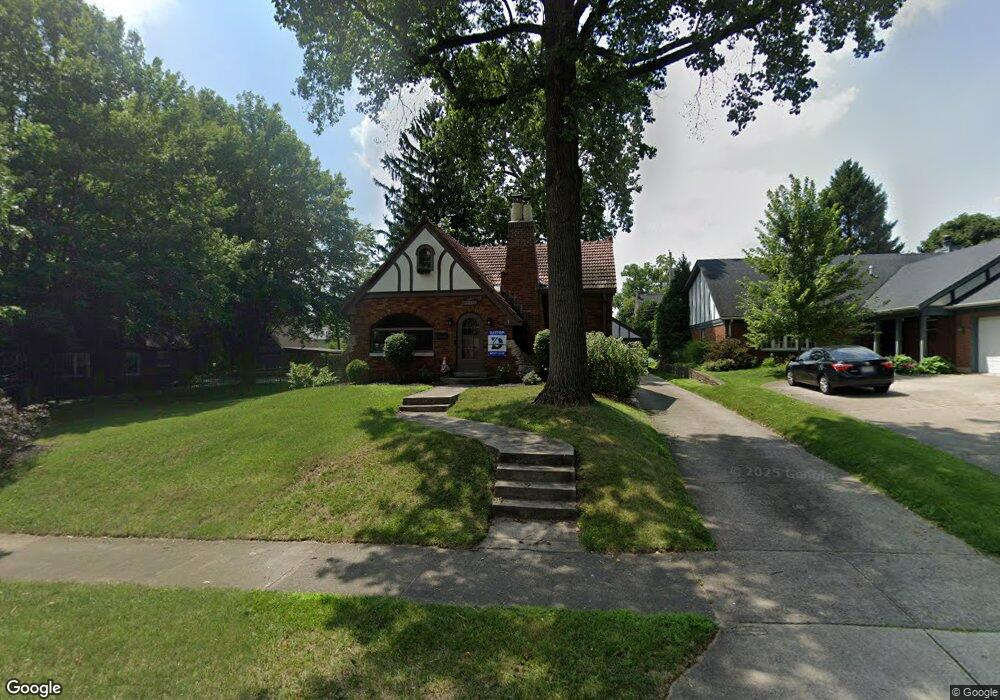
320 Greenmount Blvd Dayton, OH 45419
Estimated Value: $344,000 - $438,000
3
Beds
2
Baths
2,030
Sq Ft
$196/Sq Ft
Est. Value
About This Home
This home is located at 320 Greenmount Blvd, Dayton, OH 45419 and is currently estimated at $398,025, approximately $196 per square foot. 320 Greenmount Blvd is a home located in Montgomery County with nearby schools including Smith Elementary School, Julian & Marjorie Lange School Elementary School, and Oakwood Junior High School.
Ownership History
Date
Name
Owned For
Owner Type
Purchase Details
Closed on
Jul 30, 2018
Sold by
Smith Lois J and Smith Ronald D
Bought by
Fuqua Matthew N and Fuqua Kelly R
Current Estimated Value
Home Financials for this Owner
Home Financials are based on the most recent Mortgage that was taken out on this home.
Original Mortgage
$226,000
Outstanding Balance
$194,626
Interest Rate
4.5%
Mortgage Type
New Conventional
Estimated Equity
$203,399
Purchase Details
Closed on
Apr 24, 2006
Sold by
Griffin Lois J and Smith Lois J
Bought by
Smith Ronald D and Smith Lois J
Home Financials for this Owner
Home Financials are based on the most recent Mortgage that was taken out on this home.
Original Mortgage
$228,160
Interest Rate
7.85%
Mortgage Type
Purchase Money Mortgage
Purchase Details
Closed on
Jul 22, 1997
Sold by
Griffin Russell T
Bought by
Griffin Lois J
Create a Home Valuation Report for This Property
The Home Valuation Report is an in-depth analysis detailing your home's value as well as a comparison with similar homes in the area
Home Values in the Area
Average Home Value in this Area
Purchase History
| Date | Buyer | Sale Price | Title Company |
|---|---|---|---|
| Fuqua Matthew N | $282,500 | Fidelity Lawyers Title Agenc | |
| Smith Ronald D | -- | Preferred Choice Title Svcs | |
| Griffin Lois J | -- | -- |
Source: Public Records
Mortgage History
| Date | Status | Borrower | Loan Amount |
|---|---|---|---|
| Open | Fuqua Matthew N | $226,000 | |
| Previous Owner | Smith Ronald D | $228,160 |
Source: Public Records
Tax History
| Year | Tax Paid | Tax Assessment Tax Assessment Total Assessment is a certain percentage of the fair market value that is determined by local assessors to be the total taxable value of land and additions on the property. | Land | Improvement |
|---|---|---|---|---|
| 2025 | $8,793 | $112,550 | $27,840 | $84,710 |
| 2024 | $8,402 | $112,550 | $27,840 | $84,710 |
| 2023 | $8,402 | $112,550 | $27,840 | $84,710 |
| 2022 | $7,799 | $87,190 | $21,580 | $65,610 |
| 2021 | $7,796 | $87,190 | $21,580 | $65,610 |
| 2020 | $7,767 | $87,190 | $21,580 | $65,610 |
| 2019 | $5,402 | $56,040 | $21,580 | $34,460 |
| 2018 | $4,975 | $56,040 | $21,580 | $34,460 |
| 2017 | $4,901 | $56,040 | $21,580 | $34,460 |
| 2016 | $4,687 | $48,670 | $21,580 | $27,090 |
| 2015 | $4,350 | $48,670 | $21,580 | $27,090 |
| 2014 | $4,350 | $48,670 | $21,580 | $27,090 |
| 2012 | -- | $52,240 | $18,730 | $33,510 |
Source: Public Records
Map
Nearby Homes
- 304 Forrer Blvd
- 252 Aberdeen Ave
- 1204 Acorn Dr Unit 1134, 1136, 1204 and
- 422 Telford Ave
- 613 Gainsborough Rd
- 24 Greenmount Blvd
- 30 Dellwood Ave
- 409 Corona Ave
- 3 Aberdeen Ave
- 9 Dellwood Ave
- 826 Shroyer Rd
- 303 Hadley Ave
- 824 Shroyer Rd
- 1329 Far Hills Ave
- 2004 Shroyer Rd
- 1211 Far Hills Ave Unit 202
- 51 Forrer Rd
- 315 Patterson Rd
- 2119 Shroyer Rd
- 651 Wiltshire Blvd
- 314 Greenmount Blvd
- 332 Greenmount Blvd
- 321 Lonsdale Ave
- 327 Lonsdale Ave
- 317 Lonsdale Ave
- 336 Greenmount Blvd
- 331 Lonsdale Ave
- 311 Lonsdale Ave
- 300 Greenmount Blvd
- 342 Greenmount Blvd
- 337 Lonsdale Ave
- 307 Lonsdale Ave
- 317 Greenmount Blvd
- 323 Greenmount Blvd
- 311 Greenmount Blvd
- 333 Greenmount Blvd
- 343 Lonsdale Ave
- 301 Lonsdale Ave
- 346 Greenmount Blvd
- 337 Greenmount Blvd
Your Personal Tour Guide
Ask me questions while you tour the home.