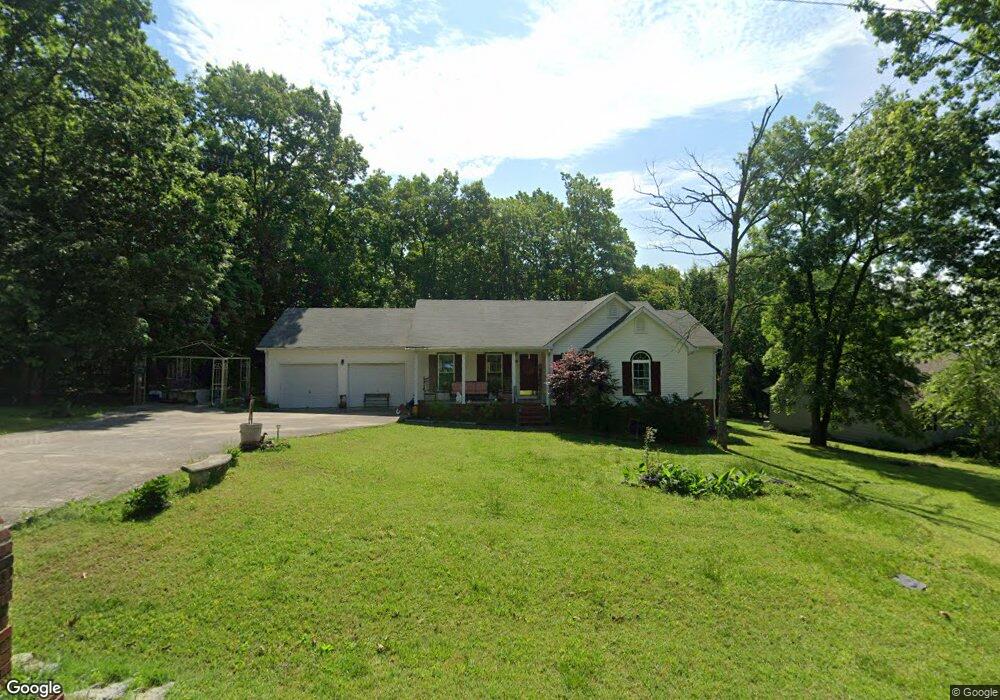
320 Hilltop Dr Shelbyville, TN 37160
Estimated Value: $279,296 - $325,000
--
Bed
2
Baths
1,412
Sq Ft
$213/Sq Ft
Est. Value
About This Home
This home is located at 320 Hilltop Dr, Shelbyville, TN 37160 and is currently estimated at $300,074, approximately $212 per square foot. 320 Hilltop Dr is a home located in Bedford County with nearby schools including South Side Elementary School, Harris Middle School, and Christian Chapel Academy.
Ownership History
Date
Name
Owned For
Owner Type
Purchase Details
Closed on
May 29, 2007
Sold by
Hodge George M
Bought by
Hodge Brenda Lucille Davis
Current Estimated Value
Purchase Details
Closed on
Jun 18, 1997
Sold by
Fisher Philip
Bought by
Hodge George M and Hodge Brenda
Home Financials for this Owner
Home Financials are based on the most recent Mortgage that was taken out on this home.
Original Mortgage
$80,930
Interest Rate
7.93%
Purchase Details
Closed on
Aug 16, 1994
Bought by
Fisher Philip Lori
Purchase Details
Closed on
Apr 21, 1994
Bought by
Glover G G
Purchase Details
Closed on
Oct 19, 1963
Bought by
Segroves Tom Trustee
Create a Home Valuation Report for This Property
The Home Valuation Report is an in-depth analysis detailing your home's value as well as a comparison with similar homes in the area
Home Values in the Area
Average Home Value in this Area
Purchase History
| Date | Buyer | Sale Price | Title Company |
|---|---|---|---|
| Hodge Brenda Lucille Davis | -- | -- | |
| Hodge George M | $81,000 | -- | |
| Fisher Philip Lori | $77,000 | -- | |
| Glover G G | $8,500 | -- | |
| Segroves Tom Trustee | -- | -- |
Source: Public Records
Mortgage History
| Date | Status | Borrower | Loan Amount |
|---|---|---|---|
| Previous Owner | Segroves Tom Trustee | $80,930 |
Source: Public Records
Tax History Compared to Growth
Tax History
| Year | Tax Paid | Tax Assessment Tax Assessment Total Assessment is a certain percentage of the fair market value that is determined by local assessors to be the total taxable value of land and additions on the property. | Land | Improvement |
|---|---|---|---|---|
| 2025 | -- | $45,200 | $0 | $0 |
| 2024 | -- | $45,200 | $12,000 | $33,200 |
| 2023 | $1,720 | $45,200 | $12,000 | $33,200 |
| 2022 | $1,770 | $45,200 | $12,000 | $33,200 |
| 2021 | $1,607 | $45,200 | $12,000 | $33,200 |
| 2020 | $1,239 | $45,200 | $12,000 | $33,200 |
| 2019 | $1,239 | $27,975 | $5,500 | $22,475 |
| 2018 | $1,211 | $27,975 | $5,500 | $22,475 |
| 2017 | $1,211 | $27,975 | $5,500 | $22,475 |
| 2016 | $1,200 | $27,975 | $5,500 | $22,475 |
| 2015 | $1,200 | $27,975 | $5,500 | $22,475 |
| 2014 | $1,018 | $25,971 | $0 | $0 |
Source: Public Records
Map
Nearby Homes