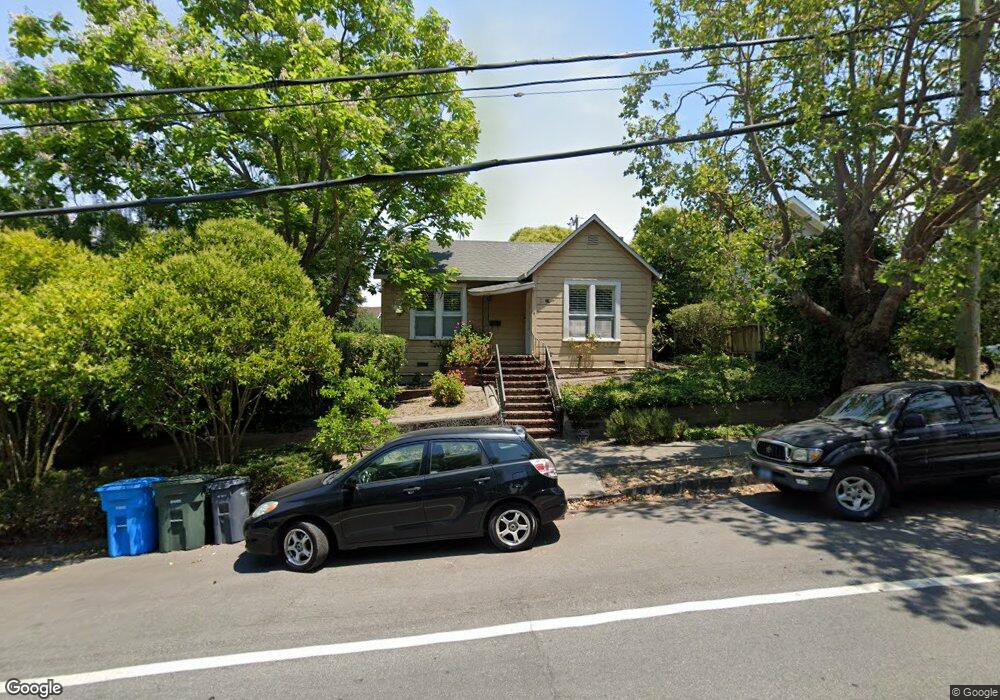
320 Keokuk St Petaluma, CA 94952
Oakhill Brewster NeighborhoodEstimated Value: $729,560 - $941,000
2
Beds
1
Bath
964
Sq Ft
$859/Sq Ft
Est. Value
About This Home
This home is located at 320 Keokuk St, Petaluma, CA 94952 and is currently estimated at $827,640, approximately $858 per square foot. 320 Keokuk St is a home located in Sonoma County with nearby schools including Valley Vista Elementary School, Petaluma Junior High School, and Petaluma High School.
Ownership History
Date
Name
Owned For
Owner Type
Purchase Details
Closed on
Jul 24, 2012
Sold by
Polymathic Properties Inc
Bought by
Tsugawa Matthew K and Millett Anne C
Current Estimated Value
Home Financials for this Owner
Home Financials are based on the most recent Mortgage that was taken out on this home.
Original Mortgage
$305,000
Outstanding Balance
$210,338
Interest Rate
3.65%
Mortgage Type
New Conventional
Estimated Equity
$617,302
Purchase Details
Closed on
Dec 13, 2011
Sold by
Gonella Christopher J and Gonella Theresa J
Bought by
Polymathic Properties Inc
Purchase Details
Closed on
Apr 11, 2000
Sold by
Beltrametti George A and Beltrametti Barbara J
Bought by
Gonella Christopher J and Gonella Theresa J
Home Financials for this Owner
Home Financials are based on the most recent Mortgage that was taken out on this home.
Original Mortgage
$181,713
Interest Rate
8.24%
Mortgage Type
Seller Take Back
Create a Home Valuation Report for This Property
The Home Valuation Report is an in-depth analysis detailing your home's value as well as a comparison with similar homes in the area
Home Values in the Area
Average Home Value in this Area
Purchase History
| Date | Buyer | Sale Price | Title Company |
|---|---|---|---|
| Tsugawa Matthew K | $413,000 | Fidelity Title Company | |
| Polymathic Properties Inc | $264,000 | None Available | |
| Gonella Christopher J | $290,000 | New Century Title Co |
Source: Public Records
Mortgage History
| Date | Status | Borrower | Loan Amount |
|---|---|---|---|
| Open | Tsugawa Matthew K | $305,000 | |
| Previous Owner | Gonella Christopher J | $181,713 |
Source: Public Records
Tax History
| Year | Tax Paid | Tax Assessment Tax Assessment Total Assessment is a certain percentage of the fair market value that is determined by local assessors to be the total taxable value of land and additions on the property. | Land | Improvement |
|---|---|---|---|---|
| 2025 | $5,503 | $508,565 | $203,179 | $305,386 |
| 2024 | $5,503 | $498,595 | $199,196 | $299,399 |
| 2023 | $5,503 | $488,820 | $195,291 | $293,529 |
| 2022 | $5,303 | $479,236 | $191,462 | $287,774 |
| 2021 | $5,203 | $469,840 | $187,708 | $282,132 |
| 2020 | $5,247 | $465,024 | $185,784 | $279,240 |
| 2019 | $5,181 | $455,907 | $182,142 | $273,765 |
| 2018 | $5,160 | $446,969 | $178,571 | $268,398 |
| 2017 | $5,052 | $438,206 | $175,070 | $263,136 |
| 2016 | $4,929 | $429,615 | $171,638 | $257,977 |
| 2015 | $4,860 | $423,162 | $169,060 | $254,102 |
| 2014 | $4,836 | $414,874 | $165,749 | $249,125 |
Source: Public Records
Map
Nearby Homes
Your Personal Tour Guide
Ask me questions while you tour the home.