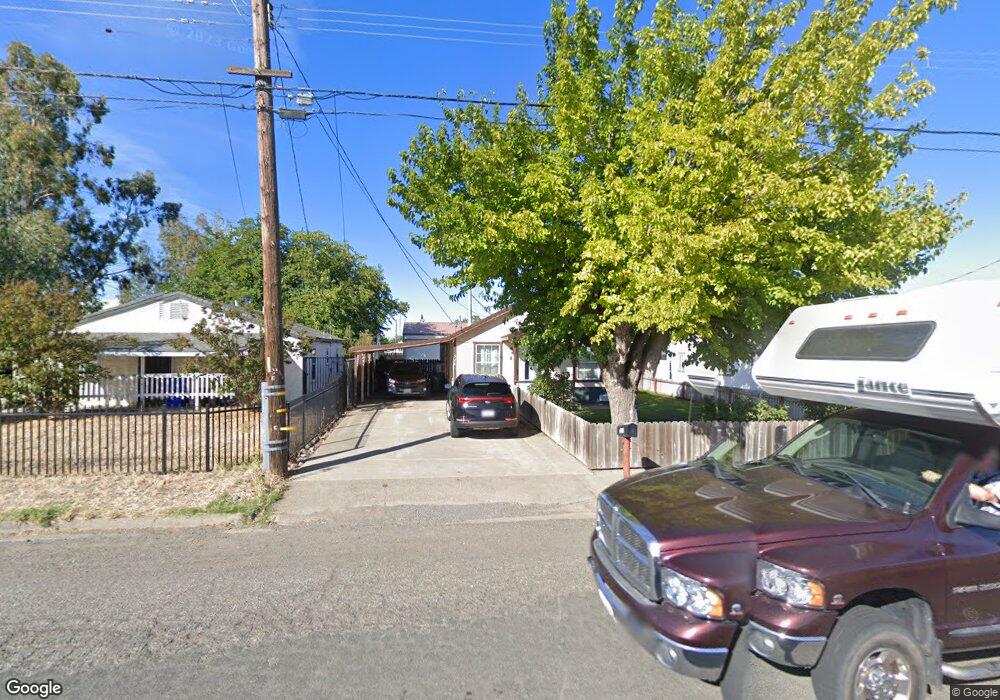
320 Kimball Rd Red Bluff, CA 96080
Estimated Value: $251,000 - $294,000
3
Beds
1
Bath
1,135
Sq Ft
$240/Sq Ft
Est. Value
About This Home
This home is located at 320 Kimball Rd, Red Bluff, CA 96080 and is currently estimated at $272,327, approximately $239 per square foot. 320 Kimball Rd is a home located in Tehama County with nearby schools including William M. Metteer Elementary School, Vista Preparatory Academy, and Red Bluff High School.
Ownership History
Date
Name
Owned For
Owner Type
Purchase Details
Closed on
Nov 18, 2021
Sold by
Kershaw Lucian R
Bought by
Murray Allicen and Mccarn William
Current Estimated Value
Home Financials for this Owner
Home Financials are based on the most recent Mortgage that was taken out on this home.
Original Mortgage
$262,626
Outstanding Balance
$240,651
Interest Rate
2.99%
Mortgage Type
New Conventional
Estimated Equity
$31,676
Purchase Details
Closed on
Oct 26, 2015
Sold by
Kershaw Shannon M
Bought by
Kershaw Lucian R
Purchase Details
Closed on
Dec 16, 2002
Sold by
Billingsley Rebel Shane and Billingsley Shala
Bought by
Kershaw Lucian R and Kershaw Shannon M
Home Financials for this Owner
Home Financials are based on the most recent Mortgage that was taken out on this home.
Original Mortgage
$113,000
Interest Rate
6.03%
Create a Home Valuation Report for This Property
The Home Valuation Report is an in-depth analysis detailing your home's value as well as a comparison with similar homes in the area
Purchase History
| Date | Buyer | Sale Price | Title Company |
|---|---|---|---|
| Murray Allicen | $260,000 | Placer Title Company | |
| Kershaw Lucian R | -- | None Available | |
| Kershaw Lucian R | $113,000 | Chicago Title Co |
Source: Public Records
Mortgage History
| Date | Status | Borrower | Loan Amount |
|---|---|---|---|
| Open | Murray Allicen | $262,626 | |
| Previous Owner | Kershaw Lucian R | $113,000 |
Source: Public Records
Tax History
| Year | Tax Paid | Tax Assessment Tax Assessment Total Assessment is a certain percentage of the fair market value that is determined by local assessors to be the total taxable value of land and additions on the property. | Land | Improvement |
|---|---|---|---|---|
| 2025 | $2,803 | $275,913 | $47,754 | $228,159 |
| 2023 | $2,756 | $265,200 | $45,900 | $219,300 |
| 2022 | $2,738 | $260,000 | $45,000 | $215,000 |
| 2021 | $1,561 | $151,193 | $33,447 | $117,746 |
| 2020 | $1,594 | $149,644 | $33,105 | $116,539 |
| 2019 | $1,535 | $140,336 | $31,048 | $109,288 |
| 2018 | $1,316 | $127,578 | $28,225 | $99,353 |
| 2017 | $1,232 | $115,980 | $25,659 | $90,321 |
| 2016 | $1,118 | $110,457 | $24,437 | $86,020 |
| 2015 | $1,047 | $110,457 | $24,437 | $86,020 |
| 2014 | $907 | $96,050 | $21,250 | $74,800 |
Source: Public Records
Map
Nearby Homes
- 131 Brookridge Dr Unit 1
- 8 Sutter St
- 4 Sutter St
- 590 Brearcliffe Dr
- 1212 S Jackson St
- 660 Villa Dr
- 425 S Jackson St
- 180 S Main St
- 406 S Jackson St
- 224 S Jackson St
- 845 Olive St
- 1210 Wetter Way
- 275 Howell Ave
- 1160 Orange St
- 1280 Southpointe Dr
- 350 Gilmore Rd Unit 16
- 195 Howell Ave
- 1235 Britt Ln
- 1307 Deborah Dr
- 1455 Acacia St
- 310 Kimball Rd
- 330 Kimball Rd
- 340 Kimball Rd Unit 344 Kimball Road
- 340 Kimball Rd
- 250 Kimball Rd Unit HUD Case Number 043-
- 250 Kimball Rd
- 335 Hinkle St
- 240 Kimball Rd
- 348 Kimball Rd
- 360 Kimball Rd
- 205 Kimball Rd
- 350 Hinkle St
- 375 Kimball Rd Unit 2560 Montgomery Rd
- 375 Kimball Rd
- 1245 Montgomery Rd
- 1375 Metzger St
- 1325/1375 Metzger St
- 1325, 1375 Metzger St
- 0 Metzger St
- 1325 Metzger St
Your Personal Tour Guide
Ask me questions while you tour the home.