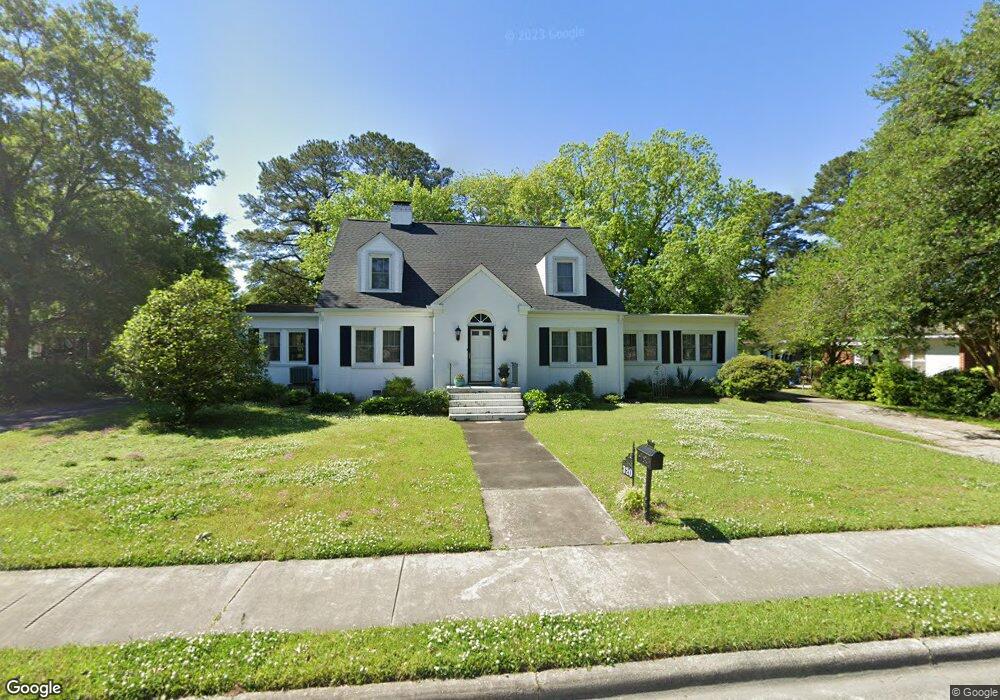
320 Main St Winterville, NC 28590
Estimated Value: $238,000 - $351,000
4
Beds
2
Baths
2,962
Sq Ft
$100/Sq Ft
Est. Value
About This Home
This home is located at 320 Main St, Winterville, NC 28590 and is currently estimated at $297,171, approximately $100 per square foot. 320 Main St is a home located in Pitt County with nearby schools including W.H. Robinson Elementary School, A.G. Cox Middle School, and South Central High School.
Create a Home Valuation Report for This Property
The Home Valuation Report is an in-depth analysis detailing your home's value as well as a comparison with similar homes in the area
Home Values in the Area
Average Home Value in this Area
Tax History
| Year | Tax Paid | Tax Assessment Tax Assessment Total Assessment is a certain percentage of the fair market value that is determined by local assessors to be the total taxable value of land and additions on the property. | Land | Improvement |
|---|---|---|---|---|
| 2025 | $1,421 | $204,014 | $18,750 | $185,264 |
| 2024 | $1,409 | $204,014 | $18,750 | $185,264 |
| 2023 | $1,410 | $174,368 | $21,000 | $153,368 |
| 2022 | $1,417 | $174,368 | $21,000 | $153,368 |
| 2021 | $1,185 | $174,368 | $21,000 | $153,368 |
| 2020 | $1,419 | $174,368 | $21,000 | $153,368 |
| 2019 | $1,358 | $165,205 | $20,000 | $145,205 |
| 2018 | $1,297 | $165,205 | $20,000 | $145,205 |
| 2017 | $1,297 | $165,205 | $20,000 | $145,205 |
| 2016 | $1,280 | $165,205 | $20,000 | $145,205 |
| 2015 | $1,319 | $171,854 | $20,000 | $151,854 |
| 2014 | $1,319 | $171,854 | $20,000 | $151,854 |
Source: Public Records
Map
Nearby Homes
- 330 Bethana Ct
- 2537 Jones St
- 2573 Graham St
- 2531 Jones St
- 2523 Jones St
- 186 Cooper St
- 227 Hammond St
- 3436 Rockbend Rd
- 2458 Jones St
- 2414 Glenda St
- 523 Village Dr
- 2774 Barefoot Ln
- 561 Channel Dr
- 263 Laurie Ellis Rd
- 2812 Cresset Dr
- 4962 Old Tar Rd
- 457 Meadowlark Dr
- 613 Brookfield Dr
- 2620 Delilah Dr
- 2544 Amanda Place
Your Personal Tour Guide
Ask me questions while you tour the home.