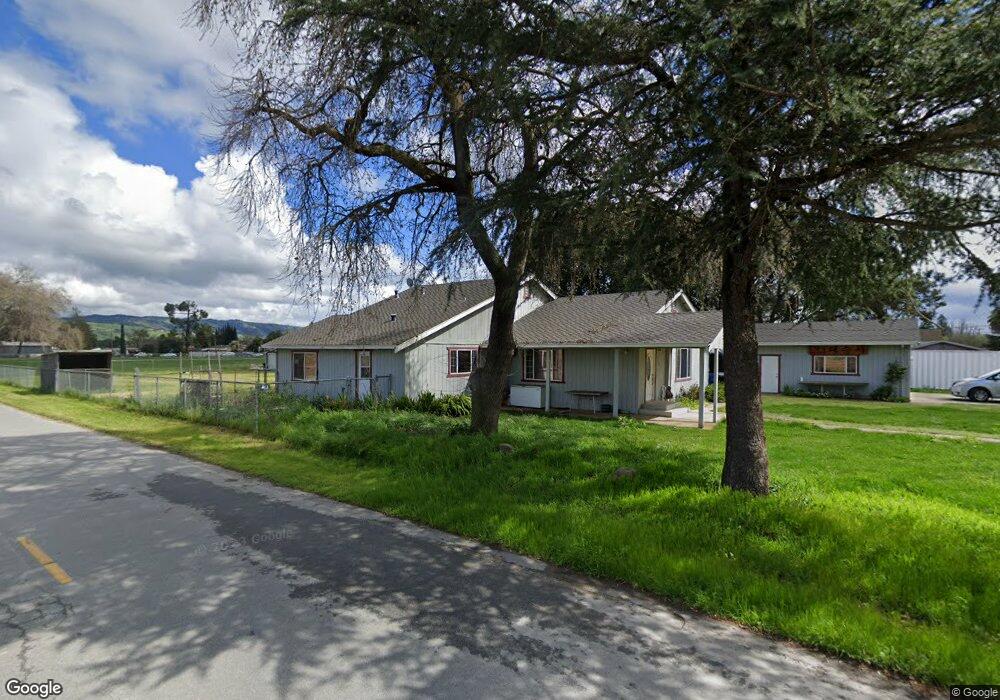
320 Market St Gilroy, CA 95020
Estimated Value: $825,000 - $1,354,000
--
Bed
--
Bath
1,756
Sq Ft
$579/Sq Ft
Est. Value
About This Home
This home is located at 320 Market St, Gilroy, CA 95020 and is currently estimated at $1,017,256, approximately $579 per square foot. 320 Market St is a home located in Santa Clara County with nearby schools including Rucker Elementary School, Solorsano Middle School, and Christopher High School.
Ownership History
Date
Name
Owned For
Owner Type
Purchase Details
Closed on
Apr 19, 2006
Sold by
Thiels Rodgers Charles Daniel and Thiels Rodgers Rene
Bought by
Thiels Rodgers Charles Daniel and Thiels Rodgers Rene
Current Estimated Value
Home Financials for this Owner
Home Financials are based on the most recent Mortgage that was taken out on this home.
Original Mortgage
$253,000
Outstanding Balance
$144,802
Interest Rate
6.29%
Mortgage Type
Fannie Mae Freddie Mac
Estimated Equity
$872,454
Purchase Details
Closed on
Jun 18, 2004
Sold by
Giancola John A and Giancola Charlene Marie
Bought by
Thiels Rodgers Charles Daniel and Thiels Rodgers Rene
Purchase Details
Closed on
May 26, 2004
Sold by
Blasdell Clark A
Bought by
Giancola John A and Giancola Charlene Marie
Create a Home Valuation Report for This Property
The Home Valuation Report is an in-depth analysis detailing your home's value as well as a comparison with similar homes in the area
Home Values in the Area
Average Home Value in this Area
Purchase History
| Date | Buyer | Sale Price | Title Company |
|---|---|---|---|
| Thiels Rodgers Charles Daniel | -- | Alliance Title Company | |
| Thiels Rodgers Charles Daniel | $350,000 | Chicago Title | |
| Giancola John A | $140,000 | Chicago Title |
Source: Public Records
Mortgage History
| Date | Status | Borrower | Loan Amount |
|---|---|---|---|
| Open | Thiels Rodgers Charles Daniel | $253,000 |
Source: Public Records
Tax History Compared to Growth
Tax History
| Year | Tax Paid | Tax Assessment Tax Assessment Total Assessment is a certain percentage of the fair market value that is determined by local assessors to be the total taxable value of land and additions on the property. | Land | Improvement |
|---|---|---|---|---|
| 2025 | $4,748 | $385,222 | $355,440 | $29,782 |
| 2024 | $4,748 | $377,670 | $348,471 | $29,199 |
| 2023 | $4,714 | $370,266 | $341,639 | $28,627 |
| 2022 | $4,629 | $363,007 | $334,941 | $28,066 |
| 2021 | $4,607 | $355,890 | $328,374 | $27,516 |
| 2020 | $4,551 | $352,241 | $325,007 | $27,234 |
| 2019 | $4,507 | $345,335 | $318,635 | $26,700 |
| 2018 | $4,194 | $338,565 | $312,388 | $26,177 |
| 2017 | $4,279 | $331,927 | $306,263 | $25,664 |
| 2016 | $4,186 | $325,419 | $300,258 | $25,161 |
| 2015 | $3,944 | $320,532 | $295,748 | $24,784 |
| 2014 | $3,881 | $314,254 | $289,955 | $24,299 |
Source: Public Records
Map
Nearby Homes
- 310 Lena Ave
- 145 Masten Ave
- 2055 Rucker Ave
- 0 Buena Vista Ave
- 0002 Buena Vista Ave
- 12320 Highland Estates Ln
- 264 Windsong Way
- 12315 Harding Ave
- 9850 Bobcat Ct
- 10055 Foothill Ave
- 11840 Foothill Ave
- 119 Farrell Ave
- 103 Farrell Ave
- 111 Farrell Ave
- 1080 Sunrise Dr
- 9632 Cherrywood Ct
- 9135 Desiderio Way
- 700 Las Animas Ave
- 1405 Lakeview Ct
- 820 Woodcreek Way