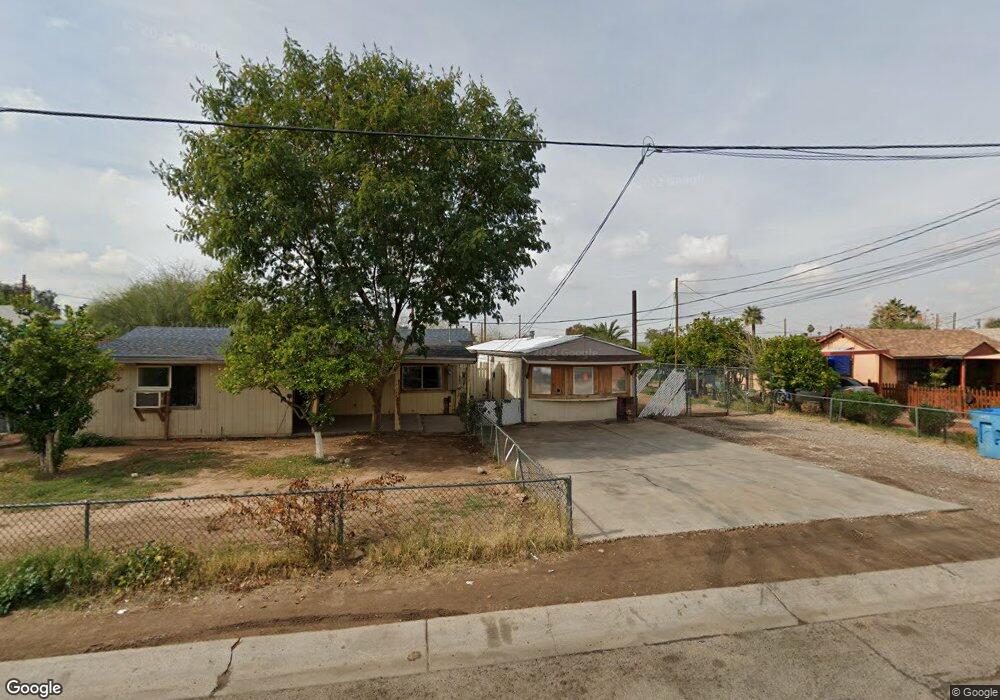
320 N 39th Dr Unit 3 Phoenix, AZ 85009
Estrella Village NeighborhoodEstimated Value: $225,305 - $330,000
2
Beds
1
Bath
862
Sq Ft
$307/Sq Ft
Est. Value
About This Home
This home is located at 320 N 39th Dr Unit 3, Phoenix, AZ 85009 and is currently estimated at $264,826, approximately $307 per square foot. 320 N 39th Dr Unit 3 is a home located in Maricopa County with nearby schools including Moya Elementary School, Morris K. Udall Middle School, and Carl Hayden High School.
Ownership History
Date
Name
Owned For
Owner Type
Purchase Details
Closed on
May 1, 2018
Sold by
Asset Roth Llc
Bought by
Ebk Corporation Inc
Current Estimated Value
Home Financials for this Owner
Home Financials are based on the most recent Mortgage that was taken out on this home.
Original Mortgage
$90,000
Outstanding Balance
$53,405
Interest Rate
4.45%
Mortgage Type
Purchase Money Mortgage
Estimated Equity
$211,421
Purchase Details
Closed on
Sep 24, 2012
Sold by
Minsberg Ron
Bought by
Wallis Mary Kathryn
Home Financials for this Owner
Home Financials are based on the most recent Mortgage that was taken out on this home.
Original Mortgage
$45,000
Interest Rate
3.58%
Mortgage Type
Seller Take Back
Purchase Details
Closed on
Oct 16, 2009
Sold by
Geurts Denise A and Cogman Cheri M
Bought by
Minsberg Ron
Purchase Details
Closed on
May 28, 1997
Sold by
Hawkins Phyllis N
Bought by
Hawkins Joseph M
Create a Home Valuation Report for This Property
The Home Valuation Report is an in-depth analysis detailing your home's value as well as a comparison with similar homes in the area
Home Values in the Area
Average Home Value in this Area
Purchase History
| Date | Buyer | Sale Price | Title Company |
|---|---|---|---|
| Ebk Corporation Inc | $90,000 | Security Title Agency Inc | |
| Wallis Mary Kathryn | $55,000 | First American Title Ins Co | |
| Minsberg Ron | -- | First American Title Ins Co | |
| Minsberg Ron | $40,000 | None Available | |
| Hawkins Joseph M | -- | -- |
Source: Public Records
Mortgage History
| Date | Status | Borrower | Loan Amount |
|---|---|---|---|
| Open | Ebk Corporation Inc | $90,000 | |
| Previous Owner | Wallis Mary Kathryn | $45,000 |
Source: Public Records
Tax History Compared to Growth
Tax History
| Year | Tax Paid | Tax Assessment Tax Assessment Total Assessment is a certain percentage of the fair market value that is determined by local assessors to be the total taxable value of land and additions on the property. | Land | Improvement |
|---|---|---|---|---|
| 2025 | $442 | $2,698 | -- | -- |
| 2024 | $431 | $2,570 | -- | -- |
| 2023 | $431 | $12,810 | $2,560 | $10,250 |
| 2022 | $411 | $9,980 | $1,990 | $7,990 |
| 2021 | $410 | $6,350 | $1,270 | $5,080 |
| 2020 | $402 | $5,660 | $1,130 | $4,530 |
| 2019 | $395 | $4,220 | $840 | $3,380 |
| 2018 | $396 | $4,120 | $820 | $3,300 |
| 2017 | $394 | $3,880 | $770 | $3,110 |
| 2016 | $381 | $3,920 | $780 | $3,140 |
| 2015 | $353 | $3,130 | $620 | $2,510 |
Source: Public Records
Map
Nearby Homes
- 326 N 39th Dr
- 3810 W Van Buren St
- 3619 W Taylor St
- 3607 W Melvin St Unit 5
- 3540 W Taylor St
- 3803 W Portland St
- 3640 W Garfield St
- 3828 W Latham St
- 1001 N 43rd Ave Unit 282
- 1001 N 43rd Ave Unit 15
- 3735 W Moreland St
- 3506 W Roosevelt St
- 3648 W Moreland St
- 2213 W Jefferson St Unit 4
- 2203 W Jefferson St Unit 1
- 3339 W Washington St Unit 2
- 1340 N 38th Dr
- 3702 W Sherman St
- 3543 W Grant St
- 3215 W Taylor St
- 320 N 39th Dr
- 320 N 39th Dr Unit 2
- 314 N 39th Dr
- 330 N 39th Dr
- 317 N 40th Ave
- 344 N 39th Dr
- 321 N 40th Ave
- 311 N 39th Dr
- 3910 W Van Buren St
- 333 N 40th Ave
- 331 N 39th Dr
- 339 N 40th Ave
- 337 N 39th Dr
- 401 N 40th Ave
- 341 N 40th Ave
- 328 N 39th Ave
- 4002 W Van Buren St Unit c
- 4002 W Van Buren St
- 4002 W Van Buren St
- 345 N 39th Dr