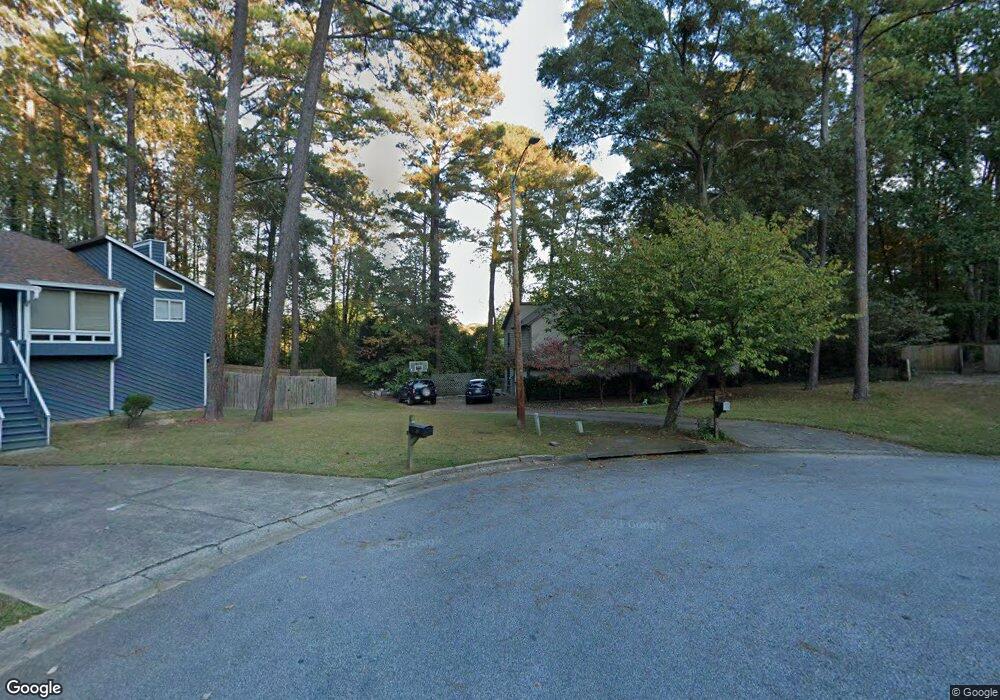
320 New Crossing Trail E Unit 3 Kennesaw, GA 30144
Sandy Plains NeighborhoodEstimated Value: $345,000 - $395,000
3
Beds
3
Baths
1,692
Sq Ft
$220/Sq Ft
Est. Value
About This Home
This home is located at 320 New Crossing Trail E Unit 3, Kennesaw, GA 30144 and is currently estimated at $372,116, approximately $219 per square foot. 320 New Crossing Trail E Unit 3 is a home located in Cobb County with nearby schools including Blackwell Elementary School, McCleskey Middle School, and Kell High School.
Ownership History
Date
Name
Owned For
Owner Type
Purchase Details
Closed on
Mar 2, 2018
Sold by
Roberts Kelly Fisher
Bought by
Roberts Jessica R and Robertson Stephen J
Current Estimated Value
Home Financials for this Owner
Home Financials are based on the most recent Mortgage that was taken out on this home.
Original Mortgage
$170,356
Outstanding Balance
$145,071
Interest Rate
4.12%
Mortgage Type
FHA
Estimated Equity
$227,045
Purchase Details
Closed on
Sep 1, 1994
Sold by
Bodine Fred Patricia
Bought by
Roberts Kirk Kelly
Home Financials for this Owner
Home Financials are based on the most recent Mortgage that was taken out on this home.
Original Mortgage
$105,300
Interest Rate
8.56%
Mortgage Type
FHA
Create a Home Valuation Report for This Property
The Home Valuation Report is an in-depth analysis detailing your home's value as well as a comparison with similar homes in the area
Home Values in the Area
Average Home Value in this Area
Purchase History
| Date | Buyer | Sale Price | Title Company |
|---|---|---|---|
| Roberts Jessica R | $173,500 | -- | |
| Roberts Kirk Kelly | $107,900 | -- |
Source: Public Records
Mortgage History
| Date | Status | Borrower | Loan Amount |
|---|---|---|---|
| Open | Roberts Jessica R | $170,356 | |
| Previous Owner | Roberts Kirk Kelly | $105,300 |
Source: Public Records
Tax History Compared to Growth
Tax History
| Year | Tax Paid | Tax Assessment Tax Assessment Total Assessment is a certain percentage of the fair market value that is determined by local assessors to be the total taxable value of land and additions on the property. | Land | Improvement |
|---|---|---|---|---|
| 2024 | $3,547 | $117,636 | $28,000 | $89,636 |
| 2023 | $3,547 | $117,636 | $28,000 | $89,636 |
| 2022 | $2,997 | $98,760 | $22,000 | $76,760 |
| 2021 | $2,491 | $82,076 | $14,000 | $68,076 |
| 2020 | $2,491 | $82,076 | $14,000 | $68,076 |
| 2019 | $1,954 | $64,368 | $14,000 | $50,368 |
| 2018 | $1,954 | $64,368 | $14,000 | $50,368 |
| 2017 | $1,730 | $60,168 | $14,000 | $46,168 |
| 2016 | $1,730 | $60,168 | $14,000 | $46,168 |
| 2015 | $1,159 | $39,356 | $14,000 | $25,356 |
| 2014 | $1,169 | $39,356 | $0 | $0 |
Source: Public Records
Map
Nearby Homes
- 597 Farmbrook Trail NE
- 529 Hawkins Store Rd NE
- 570 Charing Cross Dr
- 750 Alison Jane Ct NE
- 559 Farmbrook Trail NE
- 651 Charing Cross Dr
- 336 Nottingham Dr
- 0 Watkins Glen Dr NE Unit 10506865
- 0 Watkins Glen Dr NE Unit 7564156
- 3978 Devonshire Dr
- 4704 Lincoln Dr NE
- 0 Lake Latimer Dr NE Unit 10506857
- 44 Lake Latimer Dr NE
- 46 Lake Latimer Dr NE
- 48 Lake Latimer Dr NE
- 0 Lake Latimer Dr NE Unit 7564947
- 4110 Oak Ferry Dr NE
- The Gavin E Plan at The Village at Shallowford - Signature Series
- 318 New Crossing Trail E
- 319 New Crossing Trail E
- 316 New Crossing Trail E
- 317 New Crossing Trail E
- 457 Hawkins Store Rd NE
- 314 New Crossing Trail E
- E New Crossing Trail E
- 315 New Crossing Trail E
- 0 New Crossing Trail E Unit 8626334
- 0 New Crossing Trail E Unit 8115087
- 0 New Crossing Trail E Unit 8094851
- 0 New Crossing Trail E
- 312 New Crossing Trail E
- 313 New Crossing Trail E
- 0 Ansley Dr Unit 7625509
- 0 Ansley Dr Unit 8000415
- 0 Ansley Dr Unit 7238640
- 0 Ansley Dr
- 607 Farmbrook Trail NE Unit 1
- 607 Farmbrook Trail NE