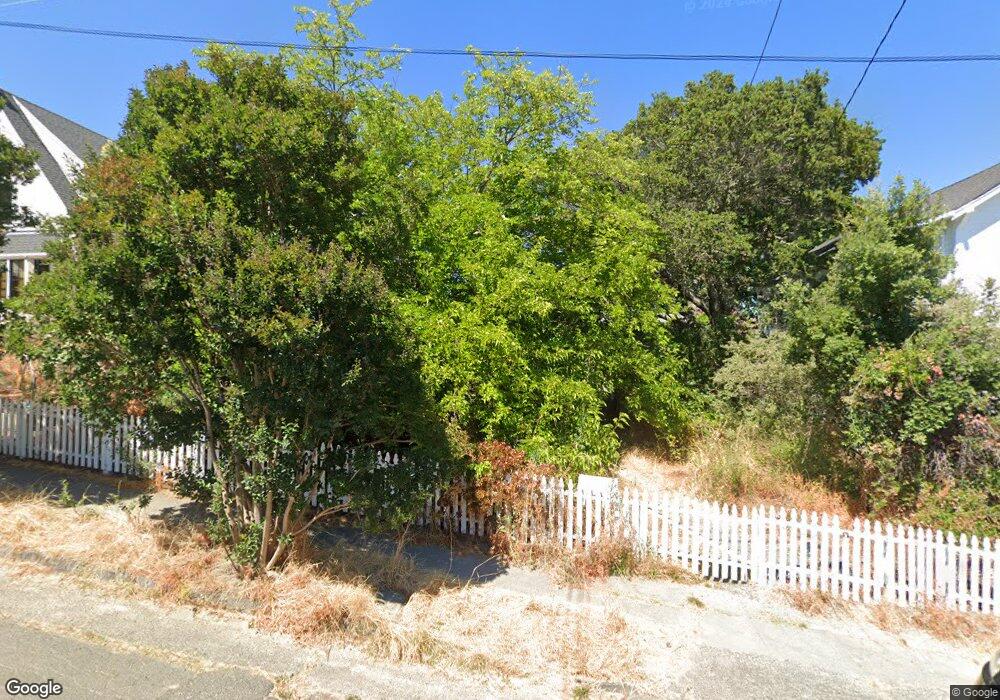
320 Pleasant St Petaluma, CA 94952
Oakhill Brewster NeighborhoodEstimated Value: $895,000 - $1,028,000
2
Beds
2
Baths
1,580
Sq Ft
$602/Sq Ft
Est. Value
About This Home
This home is located at 320 Pleasant St, Petaluma, CA 94952 and is currently estimated at $951,703, approximately $602 per square foot. 320 Pleasant St is a home located in Sonoma County with nearby schools including Valley Vista Elementary School, Petaluma Junior High School, and Petaluma High School.
Ownership History
Date
Name
Owned For
Owner Type
Purchase Details
Closed on
Jan 25, 2007
Sold by
Faraone Diane K
Bought by
Faraone D K
Current Estimated Value
Home Financials for this Owner
Home Financials are based on the most recent Mortgage that was taken out on this home.
Original Mortgage
$402,500
Outstanding Balance
$239,058
Interest Rate
6.1%
Mortgage Type
New Conventional
Estimated Equity
$712,646
Purchase Details
Closed on
Jan 17, 2007
Sold by
Faraone Diana K and Faraone K D
Bought by
Faraone Diana K
Home Financials for this Owner
Home Financials are based on the most recent Mortgage that was taken out on this home.
Original Mortgage
$402,500
Outstanding Balance
$239,058
Interest Rate
6.1%
Mortgage Type
New Conventional
Estimated Equity
$712,646
Purchase Details
Closed on
Sep 18, 2000
Sold by
Daily Douglas R
Bought by
Faraone Diana K
Home Financials for this Owner
Home Financials are based on the most recent Mortgage that was taken out on this home.
Original Mortgage
$335,000
Interest Rate
7.98%
Mortgage Type
Stand Alone First
Create a Home Valuation Report for This Property
The Home Valuation Report is an in-depth analysis detailing your home's value as well as a comparison with similar homes in the area
Home Values in the Area
Average Home Value in this Area
Purchase History
| Date | Buyer | Sale Price | Title Company |
|---|---|---|---|
| Faraone D K | -- | New Century Title Company | |
| Faraone Diana K | -- | New Century Title Company | |
| Faraone Diana K | -- | North American Title Co |
Source: Public Records
Mortgage History
| Date | Status | Borrower | Loan Amount |
|---|---|---|---|
| Open | Faraone Diana K | $402,500 | |
| Previous Owner | Faraone Diana K | $335,000 |
Source: Public Records
Tax History Compared to Growth
Tax History
| Year | Tax Paid | Tax Assessment Tax Assessment Total Assessment is a certain percentage of the fair market value that is determined by local assessors to be the total taxable value of land and additions on the property. | Land | Improvement |
|---|---|---|---|---|
| 2025 | $2,573 | $228,410 | $87,846 | $140,564 |
| 2024 | $2,573 | $223,932 | $86,124 | $137,808 |
| 2023 | $2,573 | $219,542 | $84,436 | $135,106 |
| 2022 | $2,434 | $215,238 | $82,781 | $132,457 |
| 2021 | $2,389 | $211,018 | $81,158 | $129,860 |
| 2020 | $2,408 | $208,855 | $80,326 | $128,529 |
| 2019 | $2,378 | $204,760 | $78,751 | $126,009 |
| 2018 | $2,368 | $200,746 | $77,207 | $123,539 |
| 2017 | $2,319 | $196,811 | $75,694 | $121,117 |
| 2016 | $2,258 | $192,953 | $74,210 | $118,743 |
| 2015 | $2,227 | $190,056 | $73,096 | $116,960 |
| 2014 | $2,215 | $186,334 | $71,665 | $114,669 |
Source: Public Records
Map
Nearby Homes
- 26 Wallace Ct
- 331 Keller St Unit 11
- 136 Court St
- 131 Liberty St
- 210 Keller St
- 304 West St
- 495 Cherry St
- 505 Petaluma Blvd N
- 13 Fowler Ct
- 13 Dorenfeld Ct
- 12 Dorenfeld Ct
- 513 Larch Dr
- 509 Larch Dr
- 1105 West St
- 1 Kazen Way
- Plan 3 Craftsman at Riverbend Petaluma - Wine Country Collection
- 543 Madison St
- 65 Riverbend Ln
- 100 Orchard Ln
- 811 D St
- 316 Pleasant St
- 328 Pleasant St
- 323 Howard St
- 327 Howard St
- 319 Howard St
- 312 Pleasant St
- 331 Howard St
- 315 Howard St
- 308 Pleasant St
- 321 Pleasant St
- 335 Howard St
- 329 Pleasant St
- 319 Pleasant St
- 311 Howard St
- 315 Pleasant St
- 333 Pleasant St
- 304 Pleasant St
- 304 Pleasant St
- 303 Howard St
- 309 Pleasant St