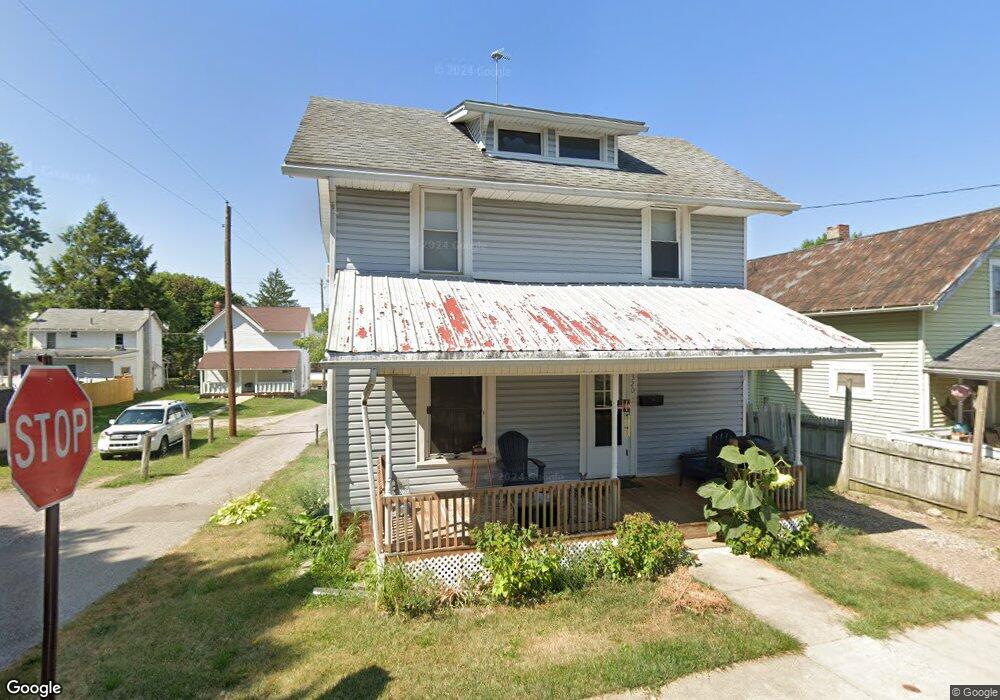
320 Prospect St Ashland, OH 44805
Estimated Value: $109,704 - $130,000
3
Beds
2
Baths
1,038
Sq Ft
$115/Sq Ft
Est. Value
About This Home
This home is located at 320 Prospect St, Ashland, OH 44805 and is currently estimated at $119,426, approximately $115 per square foot. 320 Prospect St is a home located in Ashland County with nearby schools including Ashland High School, Ashland County Community Academy, and St. Edward Elementary School.
Ownership History
Date
Name
Owned For
Owner Type
Purchase Details
Closed on
Aug 27, 2013
Sold by
Burley James H
Bought by
Britton Real Estate Llc
Current Estimated Value
Purchase Details
Closed on
Feb 8, 2010
Sold by
Dunn Michael and Dunn Gitte
Bought by
Krichbaum Rex
Purchase Details
Closed on
Nov 25, 2009
Bought by
Dunn Michael and Dunn Gitte
Purchase Details
Closed on
Mar 4, 2009
Sold by
Wolfe Michael A and Wolfe Leanna K
Purchase Details
Closed on
Jun 5, 1997
Sold by
Burley James H
Bought by
Wolfe Michael A
Purchase Details
Closed on
Oct 3, 1996
Bought by
Burley James H
Purchase Details
Closed on
Jan 1, 1990
Create a Home Valuation Report for This Property
The Home Valuation Report is an in-depth analysis detailing your home's value as well as a comparison with similar homes in the area
Home Values in the Area
Average Home Value in this Area
Purchase History
| Date | Buyer | Sale Price | Title Company |
|---|---|---|---|
| Britton Real Estate Llc | -- | -- | |
| Krichbaum Rex | $27,000 | -- | |
| Dunn Michael | $17,900 | -- | |
| -- | $15,100 | -- | |
| -- | -- | -- | |
| Wolfe Michael A | $45,000 | -- | |
| Burley James H | $11,500 | -- | |
| -- | -- | -- |
Source: Public Records
Tax History
| Year | Tax Paid | Tax Assessment Tax Assessment Total Assessment is a certain percentage of the fair market value that is determined by local assessors to be the total taxable value of land and additions on the property. | Land | Improvement |
|---|---|---|---|---|
| 2025 | $668 | $18,820 | $3,680 | $15,140 |
| 2024 | $668 | $18,820 | $3,680 | $15,140 |
| 2023 | $668 | $18,820 | $3,680 | $15,140 |
| 2022 | $627 | $13,930 | $2,720 | $11,210 |
| 2021 | $630 | $13,930 | $2,720 | $11,210 |
| 2020 | $598 | $13,930 | $2,720 | $11,210 |
| 2019 | $534 | $11,510 | $3,860 | $7,650 |
| 2018 | $539 | $11,510 | $3,860 | $7,650 |
| 2017 | $514 | $11,510 | $3,860 | $7,650 |
| 2016 | $514 | $10,460 | $3,510 | $6,950 |
| 2015 | $509 | $10,460 | $3,510 | $6,950 |
| 2013 | $895 | $18,140 | $3,470 | $14,670 |
Source: Public Records
Map
Nearby Homes
- 416-418 Carroll St
- 515 Sandusky St
- 1218 Myers Ave
- 917 Union St
- 1471 Troy Rd
- 934 Summit Dr
- 1499 Troy Rd
- 219 W Washington St
- 1411 Orange Rd
- 410 E 9th St
- 224 Sharon Ave
- 703 Grant St
- 711 Grant St
- 102 E Liberty St
- 945 Virginia Ave
- 1520 Orange Rd Unit 22
- 1520 Orange Rd
- 120 High St
- 162 Arthur's Ct
- 3 Terrace Dr
Your Personal Tour Guide
Ask me questions while you tour the home.