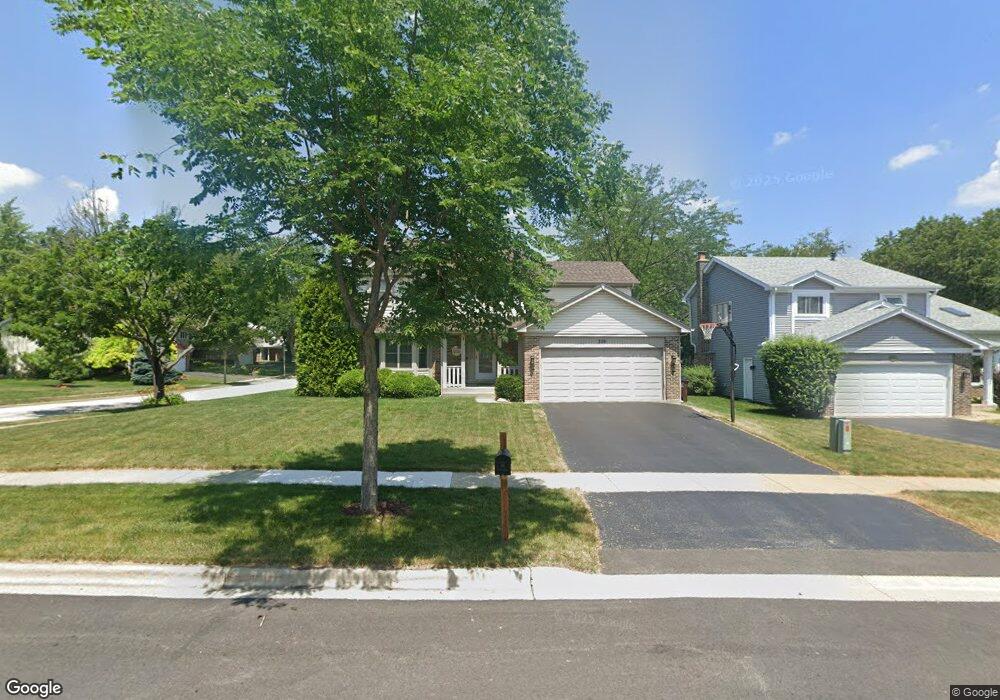
320 Quigley St Mundelein, IL 60060
Estimated Value: $416,849 - $443,000
4
Beds
3
Baths
2,126
Sq Ft
$202/Sq Ft
Est. Value
About This Home
This home is located at 320 Quigley St, Mundelein, IL 60060 and is currently estimated at $429,462, approximately $202 per square foot. 320 Quigley St is a home located in Lake County with nearby schools including Washington Early Learning Center, Mechanics Grove Elementary School, and Carl Sandburg Middle School.
Ownership History
Date
Name
Owned For
Owner Type
Purchase Details
Closed on
Nov 15, 2023
Sold by
Clapp Steven W and Clapp Amy B
Bought by
Clapp Revocable Living Trust and Clapp
Current Estimated Value
Purchase Details
Closed on
Feb 19, 1999
Sold by
Hendrickson David N and Hendrickson Heather G
Bought by
Clapp Steven W and Clapp Amy B
Home Financials for this Owner
Home Financials are based on the most recent Mortgage that was taken out on this home.
Original Mortgage
$188,000
Interest Rate
6.78%
Purchase Details
Closed on
Jul 22, 1996
Sold by
Schofield Thomas E and Schofield Michelle L
Bought by
Hendrickson David N and Hendrickson Heather G
Home Financials for this Owner
Home Financials are based on the most recent Mortgage that was taken out on this home.
Original Mortgage
$203,000
Interest Rate
8.43%
Mortgage Type
VA
Create a Home Valuation Report for This Property
The Home Valuation Report is an in-depth analysis detailing your home's value as well as a comparison with similar homes in the area
Home Values in the Area
Average Home Value in this Area
Purchase History
| Date | Buyer | Sale Price | Title Company |
|---|---|---|---|
| Clapp Revocable Living Trust | -- | None Listed On Document | |
| Clapp Steven W | $213,000 | -- | |
| Hendrickson David N | $206,000 | Attorneys Natl Title Network |
Source: Public Records
Mortgage History
| Date | Status | Borrower | Loan Amount |
|---|---|---|---|
| Previous Owner | Clapp Steven W | $188,000 | |
| Previous Owner | Hendrickson David N | $203,000 |
Source: Public Records
Tax History Compared to Growth
Tax History
| Year | Tax Paid | Tax Assessment Tax Assessment Total Assessment is a certain percentage of the fair market value that is determined by local assessors to be the total taxable value of land and additions on the property. | Land | Improvement |
|---|---|---|---|---|
| 2024 | $9,437 | $114,171 | $18,012 | $96,159 |
| 2023 | $8,877 | $96,861 | $15,281 | $81,580 |
| 2022 | $8,877 | $88,520 | $18,530 | $69,990 |
| 2021 | $8,489 | $85,419 | $17,881 | $67,538 |
| 2020 | $8,350 | $83,068 | $17,389 | $65,679 |
| 2019 | $8,081 | $80,336 | $16,817 | $63,519 |
| 2018 | $8,732 | $86,266 | $17,479 | $68,787 |
| 2017 | $8,621 | $83,551 | $16,929 | $66,622 |
| 2016 | $8,398 | $79,353 | $16,078 | $63,275 |
| 2015 | $8,223 | $74,686 | $15,073 | $59,613 |
| 2014 | $8,194 | $75,697 | $14,501 | $61,196 |
| 2012 | $8,650 | $76,369 | $14,630 | $61,739 |
Source: Public Records
Map
Nearby Homes
- 116 S Pershing Ave
- 26980 N Pierre Dr
- 29746 U S 45
- 207 N Idlewild Ave
- 250 N Fairlawn Ave
- 26892 N Iride Dr
- 1297 Spalding Dr
- 1305 Spalding Dr
- 19925 W Il Route 60
- 19738 W Martin Dr
- 331 Plaza Cir
- 26220 N Midlothian Rd
- 201 Bingham Cir
- 26642 N Il Route 83
- 208 Bingham Cir
- 547 N Ridgemoor Ave
- 619 N California Ave Unit 1
- 123 Dunton Ct
- 19330 W Lake View Ave
- 851 Glenview Ave
- 314 Quigley St
- 145 S Greenview Ave
- 424 Quigley St
- 308 Quigley St
- 139 S Greenview Ave
- 146 Michael Ave
- 407 Quigley St
- 401 Quigley St
- 146 S Greenview Ave
- 413 Quigley St
- 430 Quigley St
- 140 Michael Ave
- 419 Quigley St
- 302 Quigley St
- 140 S Greenview Ave
- 152 Michael Ave
- 133 S Greenview Ave
- 436 Quigley St
- 425 Quigley St
- 134 S Greenview Ave