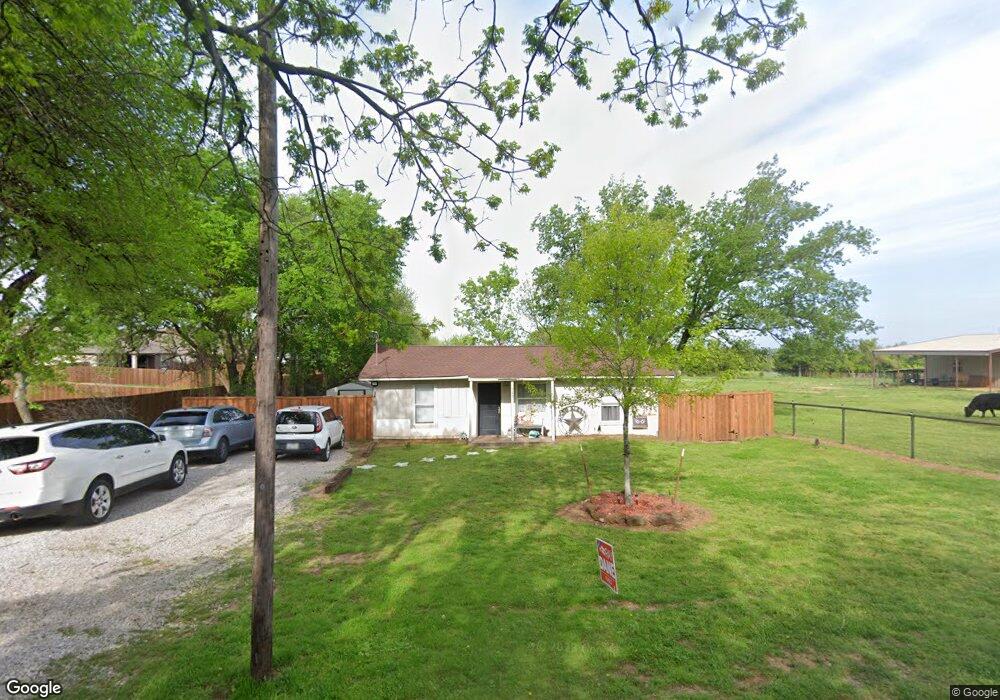
320 S Morrison St Pilot Point, TX 76258
Estimated Value: $171,893 - $299,000
2
Beds
1
Bath
999
Sq Ft
$219/Sq Ft
Est. Value
About This Home
This home is located at 320 S Morrison St, Pilot Point, TX 76258 and is currently estimated at $218,973, approximately $219 per square foot. 320 S Morrison St is a home located in Denton County with nearby schools including Pilot Point Early Childhood Center, Pilot Point Elementary School, and Pilot Point Middle School.
Ownership History
Date
Name
Owned For
Owner Type
Purchase Details
Closed on
Dec 27, 2013
Sold by
Evans Edgar
Bought by
Cain Roland Nickson and Cain Shirley Jean
Current Estimated Value
Purchase Details
Closed on
Oct 23, 2008
Sold by
Simons Andrea Jo
Bought by
Evans Edgar
Home Financials for this Owner
Home Financials are based on the most recent Mortgage that was taken out on this home.
Original Mortgage
$30,000
Interest Rate
6.5%
Mortgage Type
Purchase Money Mortgage
Create a Home Valuation Report for This Property
The Home Valuation Report is an in-depth analysis detailing your home's value as well as a comparison with similar homes in the area
Home Values in the Area
Average Home Value in this Area
Purchase History
| Date | Buyer | Sale Price | Title Company |
|---|---|---|---|
| Cain Roland Nickson | -- | Reunion Title | |
| Evans Edgar | -- | Fatco |
Source: Public Records
Mortgage History
| Date | Status | Borrower | Loan Amount |
|---|---|---|---|
| Previous Owner | Evans Edgar | $30,000 |
Source: Public Records
Tax History
| Year | Tax Paid | Tax Assessment Tax Assessment Total Assessment is a certain percentage of the fair market value that is determined by local assessors to be the total taxable value of land and additions on the property. | Land | Improvement |
|---|---|---|---|---|
| 2025 | $1,874 | $102,716 | $49,694 | $53,022 |
| 2024 | $1,874 | $104,106 | $49,694 | $54,412 |
| 2023 | $2,045 | $110,000 | $47,974 | $62,026 |
| 2022 | $1,998 | $97,159 | $40,491 | $56,668 |
| 2021 | $1,817 | $88,076 | $40,491 | $47,585 |
| 2020 | $1,352 | $65,091 | $19,877 | $45,214 |
| 2019 | $1,285 | $60,000 | $19,877 | $40,123 |
| 2018 | $1,172 | $54,000 | $18,037 | $35,963 |
| 2017 | $1,131 | $52,000 | $16,933 | $35,067 |
| 2016 | $1,044 | $48,000 | $16,565 | $31,435 |
| 2015 | $915 | $44,000 | $16,565 | $27,435 |
| 2013 | -- | $40,000 | $13,620 | $26,380 |
Source: Public Records
Map
Nearby Homes
- 326 W Liberty St
- 400 S Washington St
- TBD W Clifton St
- 405 W Clifton St
- 720 Vest Ln
- 500/504 Eddleman St
- 106 W Main St
- 500 Eddleman St Unit 504
- 11975 Massey Rd
- 111 E Liberty St
- 516 S Church St
- 9213 Wilson Rd
- 300 Bronco Dr
- lot #3 & 10 Eddleman St
- lot #4 & 9 TBD Eddleman St
- 412 N Dallas St
- 2431 Poinsettia Dr
- 2437 Poinsettia Dr
- Lot 28 Vest Ln
- Lot 24 Vest Ln
- 100 Lakeview Cir
- 104 Lakeview Cir
- 317 S Morrison St
- 425 W Division St
- 108 Lakeview Cir
- 112 Lakeview Cir
- 416 W Grove St
- 417 W Division St
- 111 Grove Cir
- 416 S Morrison St
- 116 Lakeview Cir
- 421 W Grove St
- 115 Grove Cir
- 415 W Grove St
- 119 Grove Cir
- 120 Lakeview Cir
- 111 Lakeview Cir
- 316 S Hill St
- 308 S Hill St
- 123 Grove Cir
Your Personal Tour Guide
Ask me questions while you tour the home.