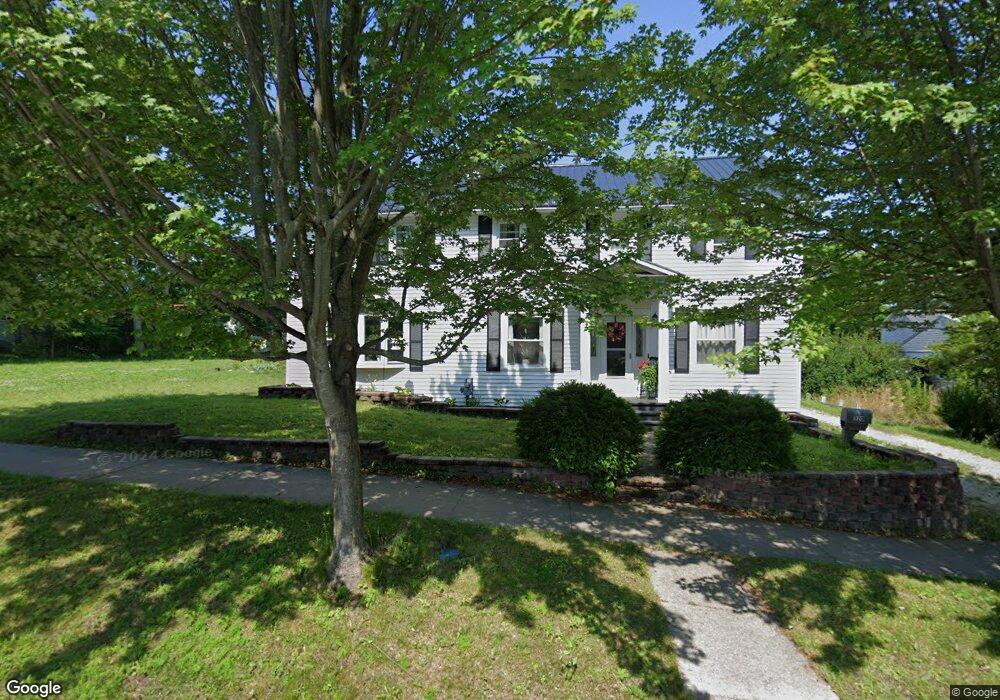
320 Sammons St Cheboygan, MI 49721
Estimated Value: $177,000 - $205,000
4
Beds
2
Baths
1,700
Sq Ft
$114/Sq Ft
Est. Value
About This Home
This home is located at 320 Sammons St, Cheboygan, MI 49721 and is currently estimated at $194,242, approximately $114 per square foot. 320 Sammons St is a home located in Cheboygan County with nearby schools including Cheboygan Intermediate School, East Elementary School, and Cheboygan Area High School.
Ownership History
Date
Name
Owned For
Owner Type
Purchase Details
Closed on
Sep 23, 2020
Sold by
Brown Mary P
Bought by
Brown Mary P
Current Estimated Value
Purchase Details
Closed on
Mar 12, 2019
Sold by
Beachnaw Craig S Est
Bought by
Brown Mary P
Purchase Details
Closed on
Jun 28, 2017
Sold by
Beachnaw Craig
Bought by
Beachnaw Craig and Brown Mary
Purchase Details
Closed on
Feb 5, 2009
Sold by
Fisher John
Bought by
Beachnaw Craig
Purchase Details
Closed on
Mar 14, 2007
Sold by
Fisher John J
Bought by
Fisher John and Fisher Amelita
Purchase Details
Closed on
Oct 1, 2004
Sold by
Mcgovern Clayton
Bought by
Fisher John H
Purchase Details
Closed on
Oct 17, 2003
Sold by
Raab Matthew
Bought by
Mcgovern Clayton and Mcgovern Penny
Create a Home Valuation Report for This Property
The Home Valuation Report is an in-depth analysis detailing your home's value as well as a comparison with similar homes in the area
Home Values in the Area
Average Home Value in this Area
Purchase History
| Date | Buyer | Sale Price | Title Company |
|---|---|---|---|
| Brown Mary P | -- | -- | |
| Brown Mary P | -- | -- | |
| Beachnaw Craig | -- | None Available | |
| Beachnaw Craig | $110,000 | -- | |
| Fisher John | -- | -- | |
| Fisher John H | $110,000 | -- | |
| Mcgovern Clayton | $75,000 | -- |
Source: Public Records
Tax History Compared to Growth
Tax History
| Year | Tax Paid | Tax Assessment Tax Assessment Total Assessment is a certain percentage of the fair market value that is determined by local assessors to be the total taxable value of land and additions on the property. | Land | Improvement |
|---|---|---|---|---|
| 2025 | $2,175 | $92,300 | $0 | $0 |
| 2024 | $1,597 | $77,600 | $0 | $0 |
| 2023 | $1,533 | $67,500 | $0 | $0 |
| 2022 | $1,482 | $55,900 | $0 | $0 |
| 2021 | $1,873 | $52,100 | $52,100 | $0 |
| 2020 | $1,856 | $52,000 | $52,000 | $0 |
| 2019 | $1,807 | $49,600 | $49,600 | $0 |
| 2018 | $1,762 | $50,100 | $0 | $0 |
| 2017 | $1,702 | $49,700 | $0 | $0 |
| 2016 | $24 | $50,400 | $0 | $0 |
| 2015 | -- | $39,500 | $0 | $0 |
| 2014 | -- | $37,600 | $0 | $0 |
| 2012 | -- | $37,000 | $0 | $0 |
Source: Public Records
Map
Nearby Homes