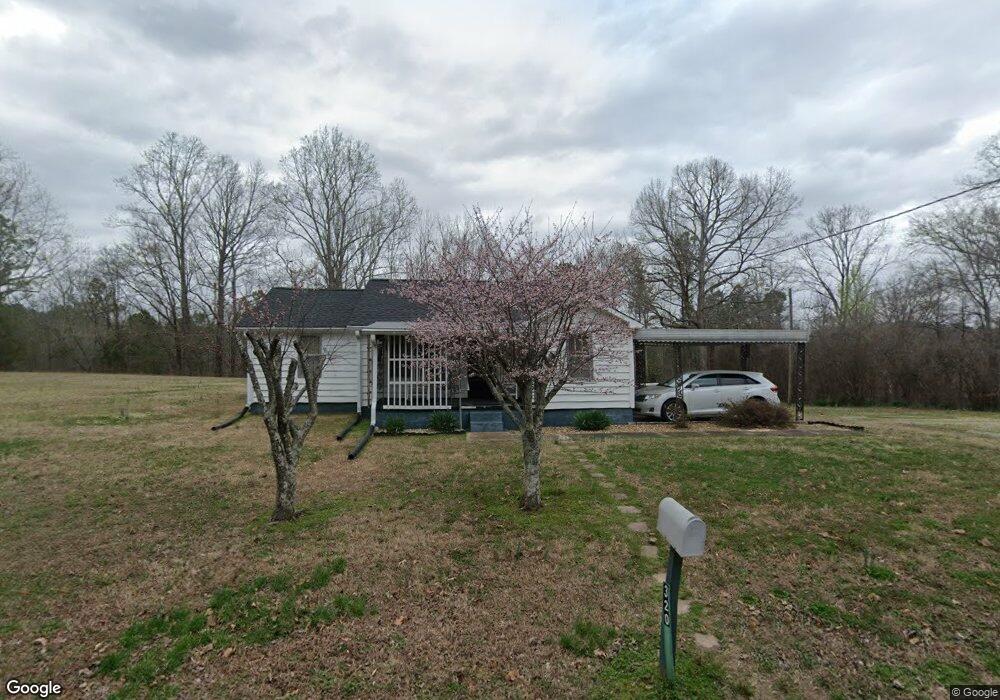
320 Sand Pit Loop Camden, TN 38320
Estimated Value: $104,666 - $131,000
--
Bed
1
Bath
980
Sq Ft
$118/Sq Ft
Est. Value
About This Home
This home is located at 320 Sand Pit Loop, Camden, TN 38320 and is currently estimated at $115,917, approximately $118 per square foot. 320 Sand Pit Loop is a home located in Benton County with nearby schools including Camden Elementary School, Briarwood School, and Camden Junior High School.
Ownership History
Date
Name
Owned For
Owner Type
Purchase Details
Closed on
Jun 30, 2008
Sold by
Marshall Dency
Bought by
Marshall Janet
Current Estimated Value
Purchase Details
Closed on
Nov 10, 1975
Bought by
Marshall Dency and Marshall Hazel
Create a Home Valuation Report for This Property
The Home Valuation Report is an in-depth analysis detailing your home's value as well as a comparison with similar homes in the area
Home Values in the Area
Average Home Value in this Area
Purchase History
| Date | Buyer | Sale Price | Title Company |
|---|---|---|---|
| Marshall Janet | -- | -- | |
| Marshall Dency | -- | -- |
Source: Public Records
Tax History Compared to Growth
Tax History
| Year | Tax Paid | Tax Assessment Tax Assessment Total Assessment is a certain percentage of the fair market value that is determined by local assessors to be the total taxable value of land and additions on the property. | Land | Improvement |
|---|---|---|---|---|
| 2024 | $355 | $13,000 | $2,100 | $10,900 |
| 2023 | $355 | $13,000 | $2,100 | $10,900 |
| 2022 | $355 | $13,000 | $2,100 | $10,900 |
| 2021 | $355 | $13,000 | $2,100 | $10,900 |
| 2020 | $355 | $13,000 | $2,100 | $10,900 |
| 2019 | $330 | $11,175 | $2,100 | $9,075 |
| 2018 | $330 | $11,175 | $2,100 | $9,075 |
| 2017 | $321 | $11,175 | $2,100 | $9,075 |
| 2016 | $321 | $10,875 | $2,100 | $8,775 |
| 2015 | $325 | $10,875 | $2,100 | $8,775 |
| 2014 | $294 | $10,875 | $2,100 | $8,775 |
| 2013 | $294 | $10,005 | $0 | $0 |
Source: Public Records
Map
Nearby Homes
- 217 Sunnyfield Ln
- 65 Sandy Point Rd
- 0 Firetower Rd
- 2642 Mount Carmel Rd
- 424 Firetower Rd
- 0 Sawyers Mill Rd
- 1785 Old Bruceton Rd
- 3150 Highway 70 W
- 106 Wyatt St N
- 571 Cheatham St
- 126 Carroll St S
- 210 Lankford St
- 138 Carroll St S
- 204 Lankford St
- 148 Highland St
- 114 Elm St
- 0 Highway 70 E
- 26295 Highway 70 E
- 1600 Eden Farm Rd
- 420 General Forrest Dr
- 0 Sand Pit Loop
- 890 Stigall Rd
- 680 Stigall Rd
- 765 Stigall Rd
- 751 Sand Pit Loop
- 10 Stepp Rd
- 70 Stepp Rd
- 485 Stigall Rd
- 250 Loneoak Ln
- 5540 Highway 70 W
- 321 Carmel Ln
- 5590 U S 70
- 1165 Stigall Rd
- 5420 Highway 70 W
- 415 Stigall Rd
- 6010 W Highway 192
- 317 Carmel Ln
- 5750 Highway 70 W
- 199 Loneoak Ln
- 5525 Highway 70 W