320 Shasta Ave Morro Bay, CA 93442
Estimated Value: $1,349,562 - $1,771,000
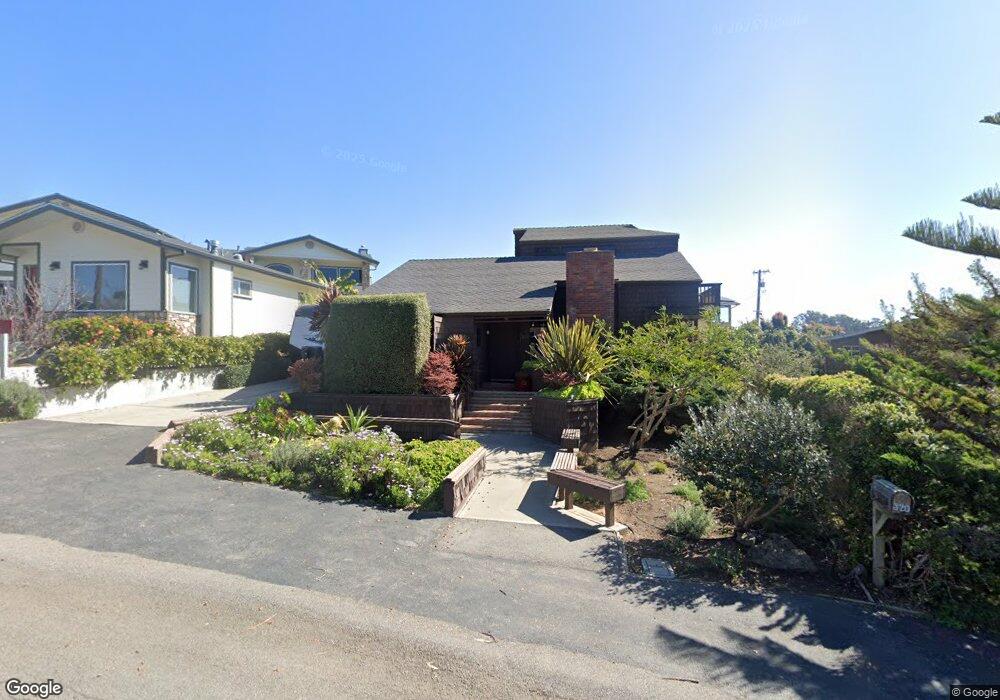
About This Home
This home is located at 320 Shasta Ave, Morro Bay, CA 93442 and is currently estimated at $1,598,141, approximately $672 per square foot. 320 Shasta Ave is a home located in San Luis Obispo County with nearby schools including Del Mar Elementary School, Los Osos Middle School, and Morro Bay High School.
Ownership History
We collect this data history from publicly available records. To have your information removed, we recommend requesting removal directly through your county’s website.
Purchase Details
Home Financials for this Owner
Home Financials are based on the most recent Mortgage that was taken out on this home.Purchase Details
Home Values in the Area
Average Home Value in this Area
Purchase History
We collect this data history from publicly available records. To have your information removed, we recommend requesting removal directly through your county’s website.
| Date | Buyer | Sale Price | Title Company |
|---|---|---|---|
| -- | Accommodation | ||
| -- | Fidelity National Title | ||
| -- | None Available |
Mortgage History
We collect this data history from publicly available records. To have your information removed, we recommend requesting removal directly through your county’s website.
| Date | Status | Borrower | Loan Amount |
|---|---|---|---|
| Previous Owner | $141,600 |
Tax History
We collect this data history from publicly available records. To have your information removed, we recommend requesting removal directly through your county’s website.
| Year | Tax Paid | Tax Assessment Tax Assessment Total Assessment is a certain percentage of the fair market value that is determined by local assessors to be the total taxable value of land and additions on the property. | Land | Improvement |
|---|---|---|---|---|
| 2025 | $2,263 | $215,991 | $37,480 | $178,511 |
| 2024 | $2,220 | $211,757 | $36,746 | $175,011 |
| 2023 | $2,220 | $207,606 | $36,026 | $171,580 |
| 2022 | $2,080 | $203,536 | $35,320 | $168,216 |
| 2021 | $2,045 | $199,546 | $34,628 | $164,918 |
| 2020 | $2,024 | $197,500 | $34,273 | $163,227 |
| 2019 | $2,001 | $193,628 | $33,601 | $160,027 |
| 2018 | $1,960 | $189,833 | $32,943 | $156,890 |
| 2017 | $1,921 | $186,112 | $32,298 | $153,814 |
| 2016 | $1,881 | $182,464 | $31,665 | $150,799 |
| 2015 | $1,852 | $179,724 | $31,190 | $148,534 |
| 2014 | $1,699 | $176,205 | $30,580 | $145,625 |
Map
- 670 Olive St
- 173 Sandpiper Ln
- 331 Fresno Ave
- 431 Fresno Ave
- 436 Morro Ave
- 490 Fresno Ave
- 490 Morro Ave Unit 5
- 245 Driftwood St
- 410 Kings Ave
- 260 Pacific St
- 600 Morro Bay Blvd Unit 203
- 929 Marina St
- 941 Marina St
- 731 Butte Ave
- 960 Las Tunas St
- 435 Dunes St
- 1151 Main St
- 375 Surf St
- 1187 Main St
- 233 Surf St Unit 6
- 280 Shasta Ave
- 270 Shasta Ave
- 290 Shasta Ave
- 260 Shasta Ave
- 299 Shasta Ave
- 250 Shasta Ave
- 300 Shasta Ave
- 281 Shasta Ave
- 260 Barlow Ln
- 250 Barlow Ln
- 271 Shasta Ave
- 291 Shasta Ave
- 261 Shasta Ave
- 310 Shasta Ave
- 244 Shasta Ave
- 299 Acacia St
- 240 Barlow Ln
- 315 Piney Ln
- 280 Palm Ave
- 300 Piney Ln Unit Lot 3
Ask me questions while you tour the home.