320 South St Concord, NH 03301
South End NeighborhoodEstimated Value: $678,492 - $799,000
4
Beds
2
Baths
1,939
Sq Ft
$377/Sq Ft
Est. Value
About This Home
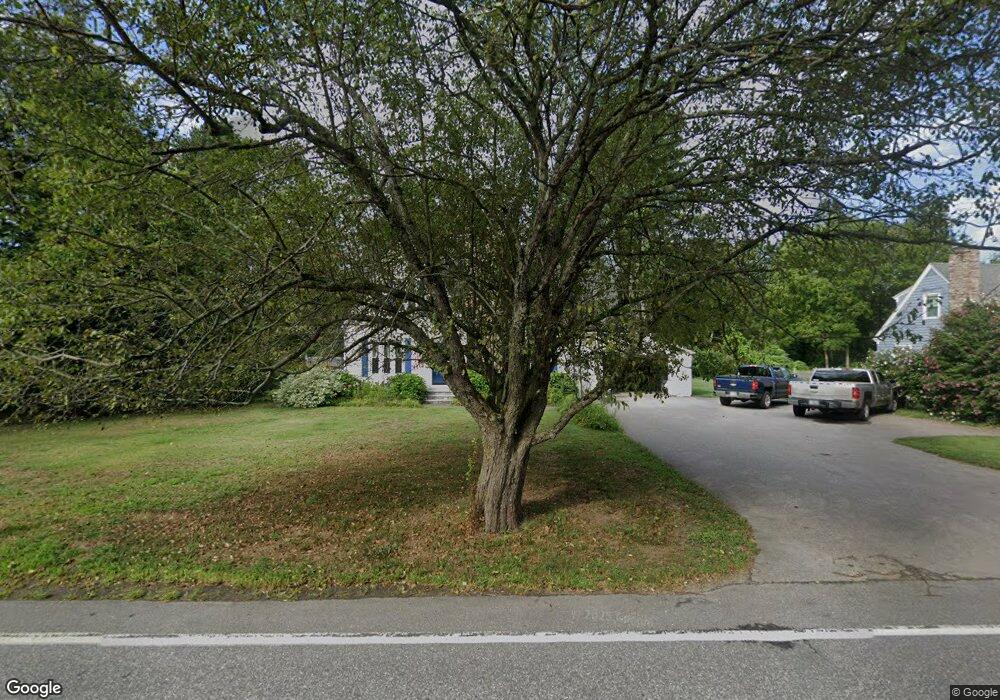
This home is located at 320 South St, Concord, NH 03301 and is currently estimated at $731,873, approximately $377 per square foot. 320 South St is a home located in Merrimack County with nearby schools including Abbot-Downing School, Rundlett Middle School, and Concord High School.
Ownership History
Date
Name
Owned For
Owner Type
Purchase Details
Closed on
Sep 13, 2021
Sold by
Reedenauer Mark P and Reedenauer Michelle L
Bought by
Reedenauer Ft 2021 and Reedenauer
Current Estimated Value
Purchase Details
Closed on
Mar 28, 2011
Sold by
Cld Asset Management L
Bought by
Reedenauer Michelle L
Home Financials for this Owner
Home Financials are based on the most recent Mortgage that was taken out on this home.
Original Mortgage
$242,687
Interest Rate
5.07%
Mortgage Type
Purchase Money Mortgage
Purchase Details
Closed on
Nov 10, 2010
Sold by
French Corliss M and French Harry W
Bought by
Cld Asset Mangement Ll
Home Financials for this Owner
Home Financials are based on the most recent Mortgage that was taken out on this home.
Original Mortgage
$175,000
Interest Rate
4.35%
Mortgage Type
Purchase Money Mortgage
Create a Home Valuation Report for This Property
The Home Valuation Report is an in-depth analysis detailing your home's value as well as a comparison with similar homes in the area
Home Values in the Area
Average Home Value in this Area
Purchase History
| Date | Buyer | Sale Price | Title Company |
|---|---|---|---|
| Reedenauer Ft 2021 | -- | None Available | |
| Reedenauer Michelle L | $249,000 | -- | |
| Cld Asset Mangement Ll | $109,500 | -- |
Source: Public Records
Mortgage History
| Date | Status | Borrower | Loan Amount |
|---|---|---|---|
| Previous Owner | Cld Asset Mangement Ll | $242,687 | |
| Previous Owner | Cld Asset Mangement Ll | $175,000 |
Source: Public Records
Tax History Compared to Growth
Tax History
| Year | Tax Paid | Tax Assessment Tax Assessment Total Assessment is a certain percentage of the fair market value that is determined by local assessors to be the total taxable value of land and additions on the property. | Land | Improvement |
|---|---|---|---|---|
| 2024 | $14,188 | $512,400 | $118,100 | $394,300 |
| 2023 | $13,763 | $512,400 | $118,100 | $394,300 |
| 2022 | $13,266 | $512,400 | $118,100 | $394,300 |
| 2021 | $12,861 | $512,000 | $117,700 | $394,300 |
| 2020 | $12,762 | $476,900 | $94,000 | $382,900 |
| 2019 | $11,656 | $419,600 | $92,100 | $327,500 |
| 2018 | $11,279 | $400,100 | $92,100 | $308,000 |
| 2017 | $10,898 | $385,900 | $92,100 | $293,800 |
| 2016 | $6,981 | $252,300 | $90,500 | $161,800 |
| 2015 | $6,553 | $239,700 | $94,500 | $145,200 |
| 2014 | $6,426 | $239,700 | $94,500 | $145,200 |
| 2013 | $6,060 | $236,900 | $94,500 | $142,400 |
| 2012 | $5,676 | $232,900 | $94,500 | $138,400 |
Source: Public Records
Map
Nearby Homes
- 53 Heather Ln
- 289 South St
- 376 S Main St
- 15 Wilson Ave
- 24 Grandview Rd
- 5 Holly Cir
- 22 Wilson Ave
- 0 South St Unit 4969509
- 6 Woodland Cir
- 22 Longmeadow Dr
- 105 S Main St
- 122 South St
- 41 Longmeadow Dr
- 12 Avon St
- 33 Spruce St
- 24 Badger St
- 4 Bow Center Rd Unit F2
- 4 Bow Center Rd Unit B2
- 0 Spruce St Unit 88
- 0 Garvins Falls Rd Unit 4 5061370