
Seller's Agent in 2025
Kim McPherson
Century 21 Galloway Realty
(315) 529-2595
56 in this area
95 Total Sales
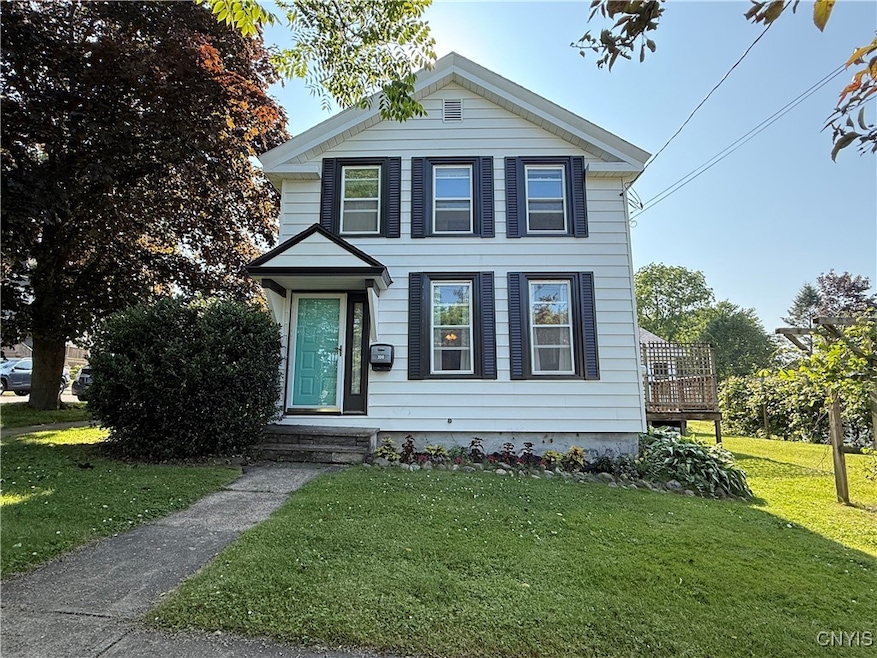
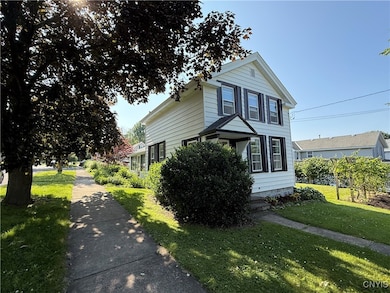
Charming West Side Gem with Modern Amenities and Endless Possibilities!
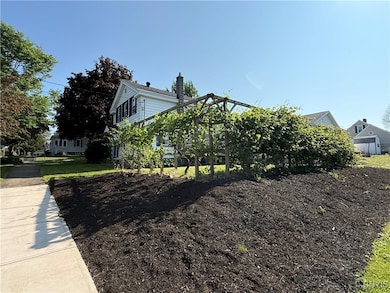
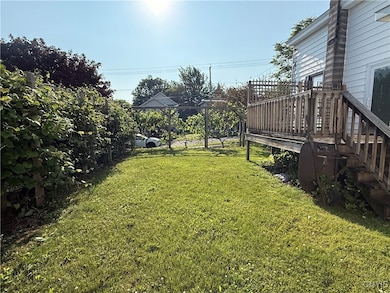
Welcome home to 320 W. 3rd Street, a meticulously maintained 3-bedroom, 2.5-bath residence ideally situated on a desirable double corner lot on Oswego's west side. Boasting over 2100 sq ft of beautifully updated living space, this home offers the perfect blend of classic charm and contemporary comfort.
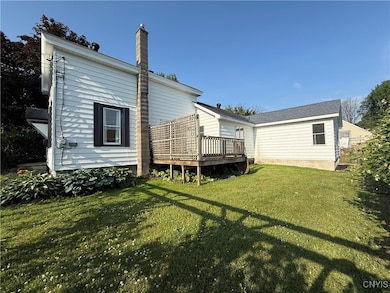
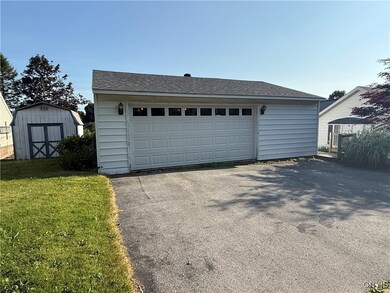
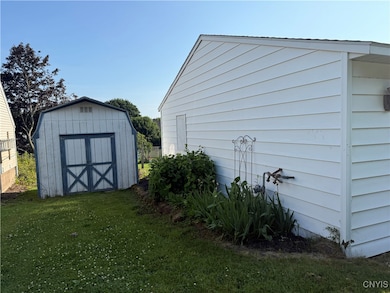
Step inside and be greeted by beautiful hardwood floors that flow throughout the open-concept living rooms and bedrooms. The kitchen area is laminate—perfect for entertaining and everyday living. The spacious kitchen is a delight, offering ample counter space, and a boat load of natural light from beautiful skylights. Convenient first-floor living is highlighted by a comfortable yet cozy primary bedroom complete with its own private en-suite bathroom and gas fireplace for greater ambiance—the perfect spot to unwind. Upstairs, you'll find two additional generous bedrooms, providing comfortable accommodations for family or guests with a newly installed full bath. A significant addition in 2020 enhanced this home, ensuring modern functionality and style allowing you to create the space you desire. Beyond the main residence, discover the incredible detached 2 plus car garage, a true bonus! This spacious garage features electric service, a convenient walk-up storage area, and even a potential office space – ideal for hobbies, a home business, or extra storage. Sitting beside that is an additional storage shed so we can see storage is no issue here!This property offers the best of both worlds: a spacious and private setting on a double lot, combined with the convenience of city living.
Last Agent to Sell the Property
Listing by Century 21 Galloway Realty License #40MC0990405 Listed on: 06/21/2025
| Date | Type | Sale Price | Title Company |
|---|---|---|---|
| Warranty Deed | $252,000 | Vanguard Research & Ttl Svcs | |
| Warranty Deed | $112,500 | None Available | |
| Warranty Deed | $112,500 | None Available | |
| Warranty Deed | $104,000 | None Available | |
| Warranty Deed | $104,000 | None Available |
| Date | Status | Loan Amount | Loan Type |
|---|---|---|---|
| Open | $232,000 | New Conventional | |
| Previous Owner | $11,250 | Stand Alone Second | |
| Previous Owner | $90,000 | New Conventional | |
| Previous Owner | $80,000 | Purchase Money Mortgage |
| Date | Event | Price | List to Sale | Price per Sq Ft |
|---|---|---|---|---|
| 08/20/2025 08/20/25 | Sold | $252,000 | +5.0% | $116 / Sq Ft |
| 06/29/2025 06/29/25 | Pending | -- | -- | -- |
| 06/21/2025 06/21/25 | For Sale | $239,900 | -- | $111 / Sq Ft |
| Year | Tax Paid | Tax Assessment Tax Assessment Total Assessment is a certain percentage of the fair market value that is determined by local assessors to be the total taxable value of land and additions on the property. | Land | Improvement |
|---|---|---|---|---|
| 2024 | $3,400 | $180,000 | $22,200 | $157,800 |
| 2023 | $3,334 | $128,000 | $13,000 | $115,000 |
| 2022 | $3,379 | $128,000 | $13,000 | $115,000 |
| 2021 | $3,437 | $128,000 | $13,000 | $115,000 |
| 2020 | $1,866 | $112,500 | $13,000 | $99,500 |
| 2019 | $2,886 | $112,500 | $13,000 | $99,500 |
| 2018 | $2,886 | $112,500 | $13,000 | $99,500 |
| 2017 | $2,875 | $112,500 | $13,000 | $99,500 |
| 2016 | $1,081 | $112,500 | $13,000 | $99,500 |
| 2015 | -- | $112,500 | $13,000 | $99,500 |
| 2014 | -- | $112,500 | $13,000 | $99,500 |
Seller's Agent in 2025
Kim McPherson
Century 21 Galloway Realty
(315) 529-2595
56 in this area
95 Total Sales
Buyer's Agent in 2025
Teri Beckwith
Hunt Real Estate
(315) 592-1471
36 in this area
284 Total Sales
Source: Central New York Information Services
MLS Number: S1616933
APN: 351200-146-023-0006-015-000-0000
Disclaimer: Certain information contained herein is derived from information provided by parties other than Homes.com. All information provided is deemed reliable, but is not guaranteed to be accurate and should be independently verified.
![]() The data relating to real estate on this web site comes in part from the Internet Data Exchange (IDX) Program of the CNYIS, UNYREIS and WNYREIS. Real estate listings held by firms other than Homes.com, LLC are marked with the IDX logo and include the Listing Broker’s Firm Name.
The data relating to real estate on this web site comes in part from the Internet Data Exchange (IDX) Program of the CNYIS, UNYREIS and WNYREIS. Real estate listings held by firms other than Homes.com, LLC are marked with the IDX logo and include the Listing Broker’s Firm Name.
Disclaimer: All information deemed reliable but not guaranteed and should be independently verified. All properties are subject to prior sale, change or withdrawal. Neither the listing broker(s) nor Homes.com, LLC shall be responsible for any typographical errors, misinformation, misprints, and shall be held totally harmless. © 2026 CNYIS, UNYREIS, WNYREIS. All rights reserved.
Ask me questions while you tour the home.