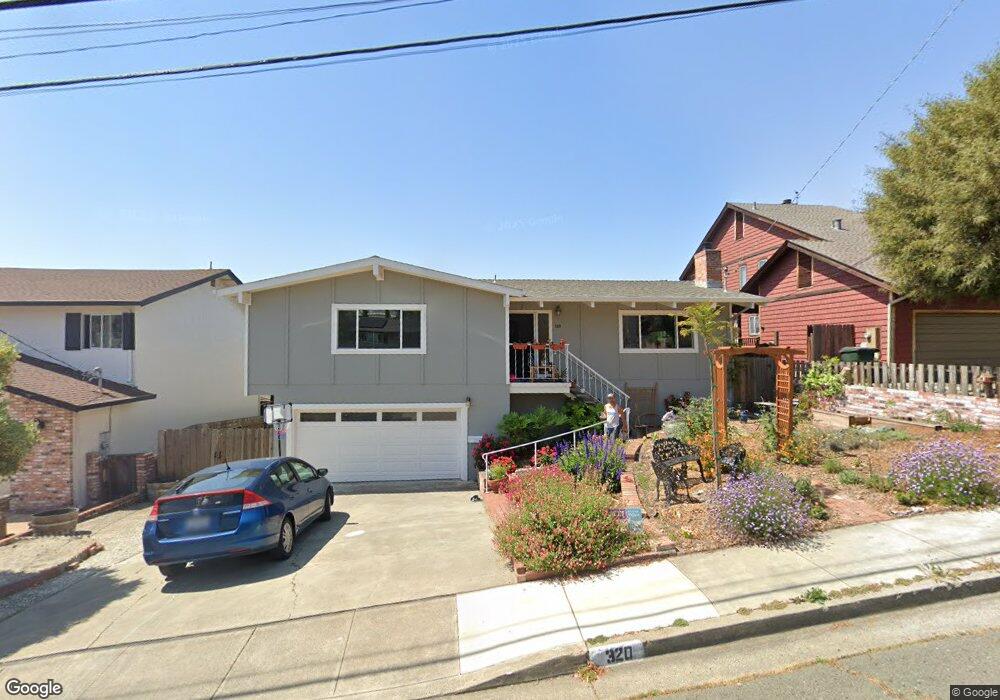
320 W M St Benicia, CA 94510
Estimated Value: $1,047,974 - $1,154,000
4
Beds
3
Baths
2,190
Sq Ft
$496/Sq Ft
Est. Value
About This Home
This home is located at 320 W M St, Benicia, CA 94510 and is currently estimated at $1,085,994, approximately $495 per square foot. 320 W M St is a home located in Solano County with nearby schools including Mary Farmar Elementary School, Benicia Middle School, and Benicia High School.
Ownership History
Date
Name
Owned For
Owner Type
Purchase Details
Closed on
Sep 27, 2020
Sold by
Wilson James F and Wilson Douglas C
Bought by
Romero Allison M and Romero Abel A
Current Estimated Value
Home Financials for this Owner
Home Financials are based on the most recent Mortgage that was taken out on this home.
Original Mortgage
$510,000
Outstanding Balance
$453,618
Interest Rate
2.9%
Mortgage Type
New Conventional
Estimated Equity
$632,376
Create a Home Valuation Report for This Property
The Home Valuation Report is an in-depth analysis detailing your home's value as well as a comparison with similar homes in the area
Home Values in the Area
Average Home Value in this Area
Purchase History
| Date | Buyer | Sale Price | Title Company |
|---|---|---|---|
| Romero Allison M | $895,000 | Old Republic Title Company |
Source: Public Records
Mortgage History
| Date | Status | Borrower | Loan Amount |
|---|---|---|---|
| Open | Romero Allison M | $510,000 |
Source: Public Records
Tax History Compared to Growth
Tax History
| Year | Tax Paid | Tax Assessment Tax Assessment Total Assessment is a certain percentage of the fair market value that is determined by local assessors to be the total taxable value of land and additions on the property. | Land | Improvement |
|---|---|---|---|---|
| 2025 | $11,350 | $968,774 | $297,668 | $671,106 |
| 2024 | $11,350 | $949,780 | $291,832 | $657,948 |
| 2023 | $11,077 | $931,158 | $286,110 | $645,048 |
| 2022 | $10,871 | $912,900 | $280,500 | $632,400 |
| 2021 | $10,650 | $895,000 | $275,000 | $620,000 |
| 2020 | $1,144 | $102,589 | $12,874 | $89,715 |
| 2019 | $1,123 | $100,578 | $12,622 | $87,956 |
| 2018 | $1,093 | $98,607 | $12,375 | $86,232 |
| 2017 | $1,067 | $96,675 | $12,133 | $84,542 |
| 2016 | $1,064 | $94,781 | $11,896 | $82,885 |
| 2015 | $1,036 | $93,358 | $11,718 | $81,640 |
| 2014 | $1,022 | $91,530 | $11,489 | $80,041 |
Source: Public Records
Map
Nearby Homes
- 1448 Ohare Dr
- 500 Raymond Dr
- 144 W N St
- 47 Alta Loma
- 1885 Shirley Dr
- 1893 Shirley Dr
- 15 Buena Vista
- 119 Mountview Terrace
- 676 W I St
- 565 Lori Dr Unit 19
- 2000 Clearview Cir
- 141 E F St
- 2016 Clearview Cir
- 117 Sunset Cir Unit 34
- 117 Sunset Cir Unit 36
- 375 E O St
- 300 E H St Unit 225
- 258 E E St Unit 18
- 2135 E 2nd St
- 1811 Pacifica Ct