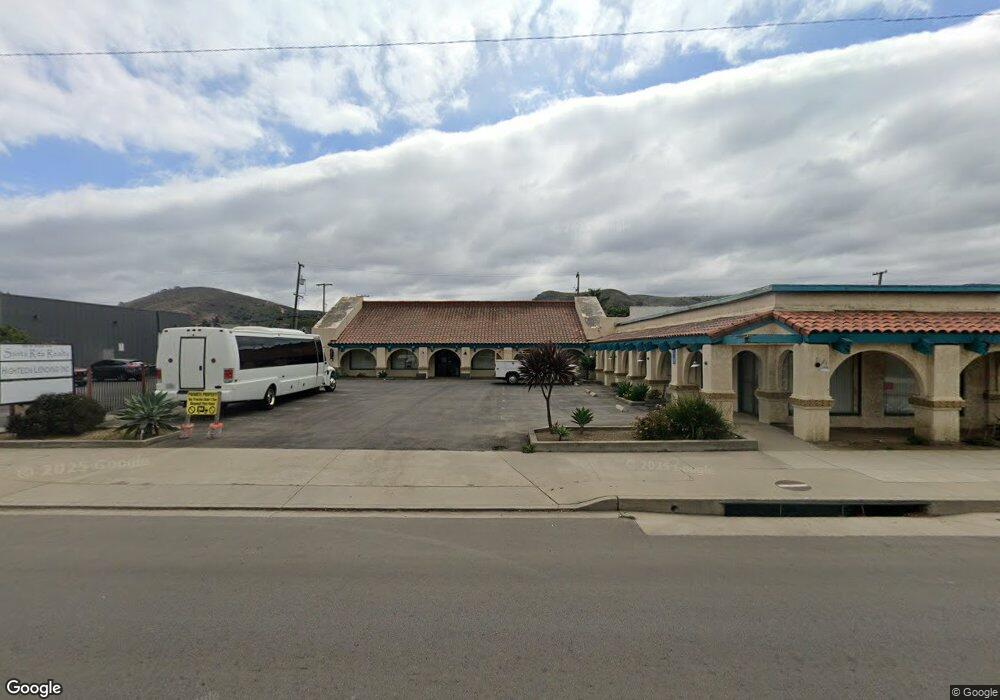
320 W Ocean Ave Lompoc, CA 93436
Estimated Value: $702,342
Studio
--
Bath
6,000
Sq Ft
$117/Sq Ft
Est. Value
About This Home
This home is located at 320 W Ocean Ave, Lompoc, CA 93436 and is currently estimated at $702,342, approximately $117 per square foot. 320 W Ocean Ave is a home located in Santa Barbara County with nearby schools including Arthur Hapgood Elementary School, Lompoc Valley Middle School, and Lompoc High School.
Ownership History
Date
Name
Owned For
Owner Type
Purchase Details
Closed on
Nov 17, 2010
Sold by
Aguiniga Maria Del Carmen
Bought by
Gonzales Nicholas
Current Estimated Value
Home Financials for this Owner
Home Financials are based on the most recent Mortgage that was taken out on this home.
Original Mortgage
$260,000
Interest Rate
4.16%
Mortgage Type
Seller Take Back
Purchase Details
Closed on
Sep 29, 2010
Sold by
Jensen Hazel Frances
Bought by
Gonzales Nicholas
Home Financials for this Owner
Home Financials are based on the most recent Mortgage that was taken out on this home.
Original Mortgage
$260,000
Interest Rate
4.16%
Mortgage Type
Seller Take Back
Purchase Details
Closed on
Sep 25, 2008
Sold by
Jensen Hazel Frances
Bought by
Jensen Hazel Frances and Jensen Family Residual Trust
Purchase Details
Closed on
Jan 11, 2005
Sold by
Ferrari Ronald J and Ferrari Glenda R
Bought by
Jensen Hazel Frances
Create a Home Valuation Report for This Property
The Home Valuation Report is an in-depth analysis detailing your home's value as well as a comparison with similar homes in the area
Home Values in the Area
Average Home Value in this Area
Purchase History
| Date | Buyer | Sale Price | Title Company |
|---|---|---|---|
| Gonzales Nicholas | -- | Fidelity National Title Co | |
| Gonzales Nicholas | $290,000 | Fidelity National Title Co | |
| Jensen Hazel Frances | -- | None Available | |
| Jensen Hazel Frances | $187,500 | Fidelity National Title Co |
Source: Public Records
Mortgage History
| Date | Status | Borrower | Loan Amount |
|---|---|---|---|
| Previous Owner | Gonzales Nicholas | $260,000 |
Source: Public Records
Tax History
| Year | Tax Paid | Tax Assessment Tax Assessment Total Assessment is a certain percentage of the fair market value that is determined by local assessors to be the total taxable value of land and additions on the property. | Land | Improvement |
|---|---|---|---|---|
| 2025 | $4,110 | $371,527 | $89,675 | $281,852 |
| 2023 | $4,110 | $357,102 | $86,194 | $270,908 |
| 2022 | $4,036 | $350,101 | $84,504 | $265,597 |
| 2021 | $4,078 | $343,238 | $82,848 | $260,390 |
| 2020 | $4,035 | $339,720 | $81,999 | $257,721 |
| 2019 | $3,968 | $333,060 | $80,392 | $252,668 |
| 2018 | $3,907 | $326,530 | $78,816 | $247,714 |
| 2017 | $3,835 | $320,128 | $77,271 | $242,857 |
| 2016 | $3,766 | $313,852 | $75,756 | $238,096 |
| 2014 | $3,686 | $303,085 | $73,158 | $229,927 |
Source: Public Records
Map
Nearby Homes
- 117 S I St
- 217 N M St
- 215 S H St
- 801, 851 California 246
- 425 S J St
- 205 S E St
- 510 N I St
- 526 N L St
- 1011 W Walnut Ave
- 413 S O Place
- 23 Village Circle Dr
- 533 N G St
- 267 Village Circle Dr
- 531 N O St
- 319 S B St
- 1311 W Cypress Ave Unit B2
- 1410 W Apricot Ave
- 616 University Dr
- 1408 W Walnut Ave
- 1355 Crown Cir
Your Personal Tour Guide
Ask me questions while you tour the home.